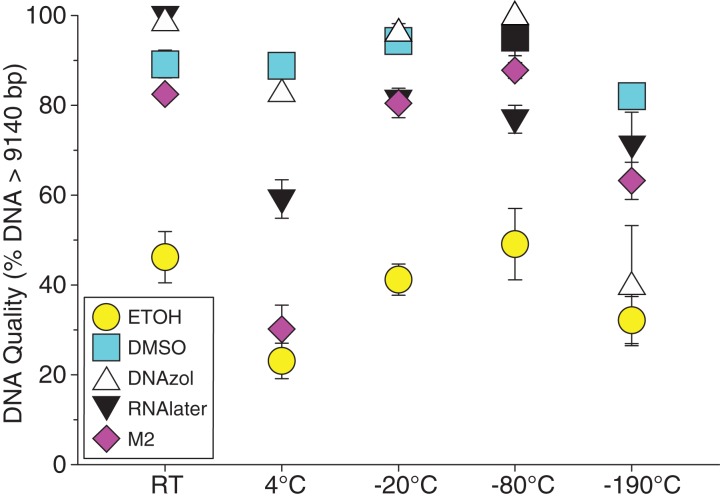
Figure 8. Graph of fish Temperature Experiment.
Quality of gDNA extracted from white perch, Morone americana. Quality of extracted gDNA is shown as the mean % of gDNA > 9,416 bp (±SE) on y-axis. Preservation solutions are differentiated by symbols (see legend). Temperatures are shown on the x-axis for the five temperatures tissue samples were held after preservation. See Table 2 for exact values of each temperature.

