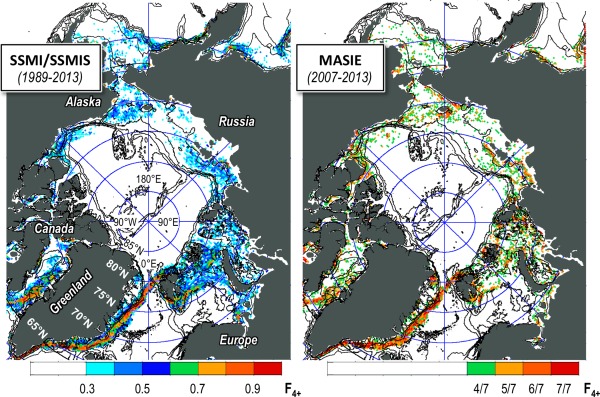
Figure 7.

Loitering frequency F4+ for (a) SSMI/SSMIS and (b) MASIE. Each pixel shows the fraction of years over the time period indicated that at least one loitering event occurred (for n = 4 days). Color scales emphasize areas with persistent loitering; MASIE has higher values everywhere, relative to SSMI/SSMIS. Isobaths are plotted for depths of 30, 100, 300, 1000, and 2000 m.
