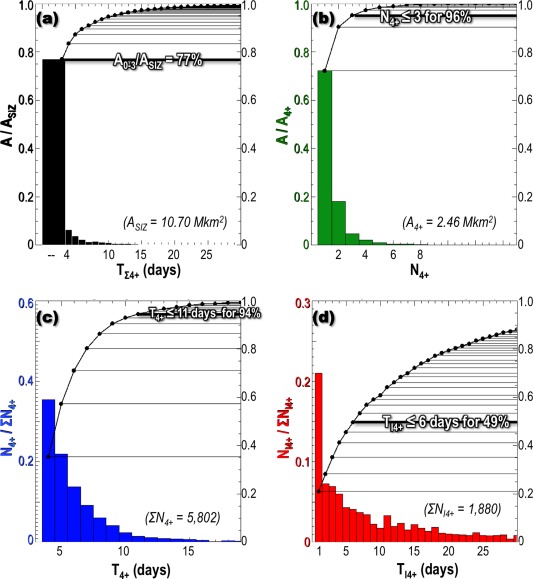
Figure 8.

Summary loitering statistics for the retreat season of 2011, i.e., (a) total loitering time TΣ4+, (b) number of loitering events N4+, (c) loitering time in each event T4+, and (d) number of days between loitering events TI4+. Left scales refer to the histogram bars, and right scales refer to the cumulative curves. Histogram colors correspond to multiyear analyses presented in Figure 9.
