Figure 16.

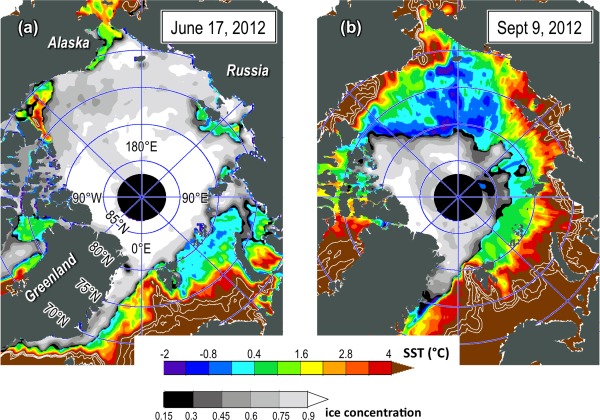
Sea surface temperature (color) and sea ice concentration (gray scale) on 2 days in 2012. As in Figure 12, extra temperature contours (white) are provided for 5°C, 6°C, and 7°C.

Sea surface temperature (color) and sea ice concentration (gray scale) on 2 days in 2012. As in Figure 12, extra temperature contours (white) are provided for 5°C, 6°C, and 7°C.