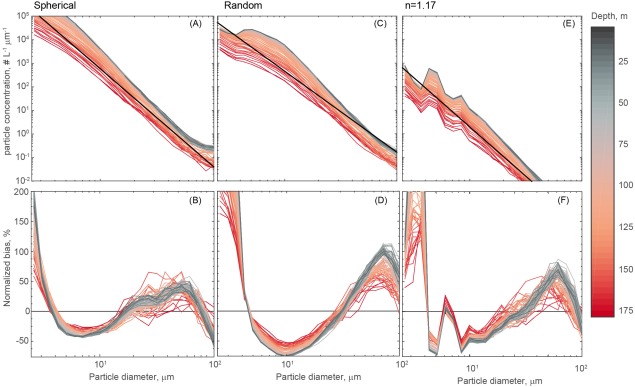
Figure 1.

The mean PSD derived from a spherical inversion (a), random inversion (c) and n = 1.17 (e). Data are binned to 2 m depth bins, and each sample represents the median of all available LISST profiles at that depth. The black line indicates the mean power law fit. The normalized bias of a power law fit is shown for the spherical (b), random (d) and n = 1.17 (f) inversions as a function of size (x‐axis) and depth (color scale).
