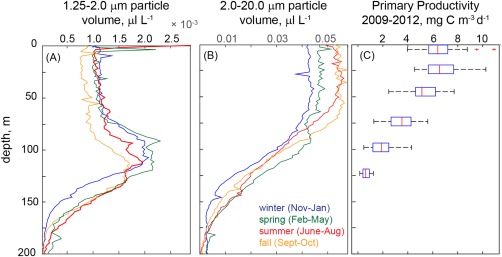
Figure 6.

Mean particle volume normalized to the maximum particle volume for each profile in two size classes: (a) 1.25–2 μm and (b) 2–20 μm. Profiles are shown as the mean for each season (months noted in the legend). Note that the x‐axis limits differ. The depth profile of primary productivity measured at HOT standard sampling depths (5, 25, 75, 100, and 125 m) is shown in panel C, where the central mark of each box is the median, the edges of the boxes are the 25th and 75th percentile and whiskers extend to the 95th percentile. Outliers are plotted as crosses.
