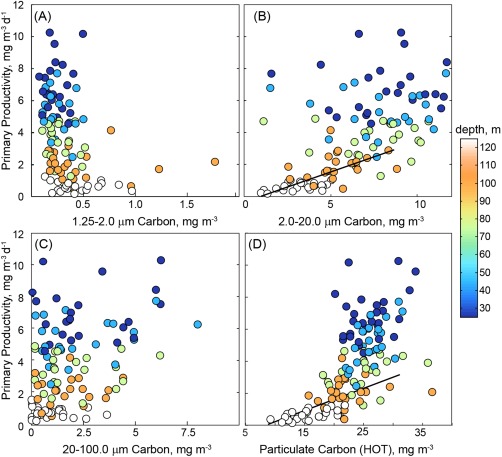
Figure 9.

Relationship between the rate of NPP measured in 12 h in situ incubations at Station ALOHA between September 2009 and December 2012 and the carbon content of particles in the following size classes: (a) 1.25–2.0 μm, (b) 2.0–2 0 μm, (c) 20–100 μm as well as (d) particulate carbon collected by HOT program. LISST data are the mean of values measured within ±2m of the depth of NPP incubations. Colors correspond to depth. Total particulate carbon and particles in the 2–20 μm range show a positive relationship to measured productivity rates, however this relationship is only linearly significant at 100 and 125 m depth horizons (Type II linear regression shown in Figure 9b: slope = 0.36 d−1, R2 = 0.41; Type II linear regression shown in Figure 9d: slope = 0.13 d−1, R2 = 0.43).
