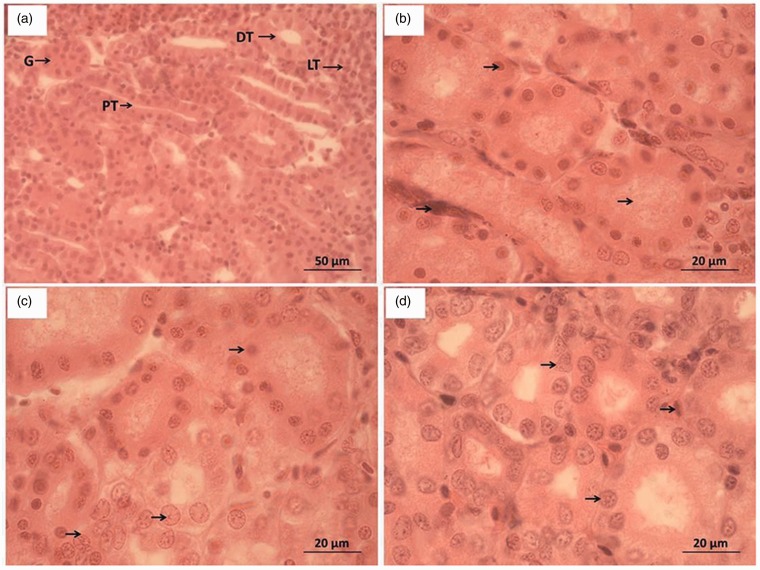
Figure 4.
Morphological observation of kidney tissue sections PT: Proximal convoluted tubules; DT: Distal convoluted tubules; LT: Lymphoid tissues; G: Glomeruli. (a) Control group (×400), (b) Group D at 24 h after discontinuation (×1000), (c) Group H at 24 h after discontinuation (×1000); and (d) Groups D and H at 240 h after discontinuation (×1000). (A color version of this figure is available in the online journal.)

