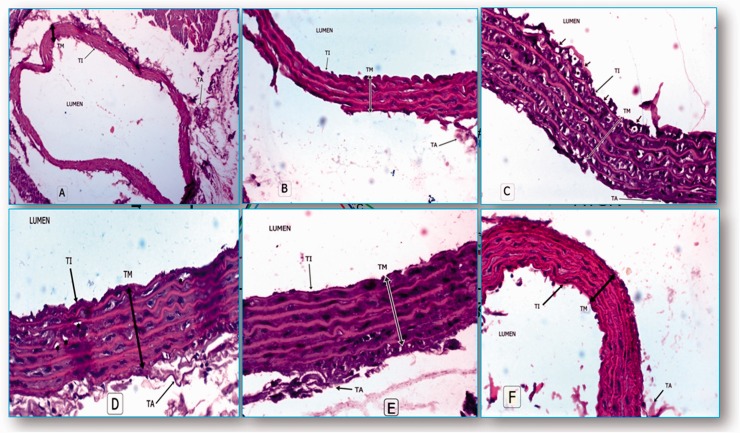
Figure 2.
((a) and (b)) Photomicrograph of normal aorta, (a) (H&E × 150), (b) (H&E × 200). (c) Aorta of DHC rats illustrated large lipid vacuoles or foam cells (*stars) in the cells of tunica intimae (TI), tunica media (TM) with ulceration of the intimal endothelial cells and loose tunica adventitia (TA) (H&E × 200). (d) Aorta of ATOR-treated rats (H&E × 200). (f) Aorta of ω-3 treated-rats (H&E × 200). (e) Aorta of PC-treated rats (H & E × 200). (A color version of this figure is available in the online journal.)

