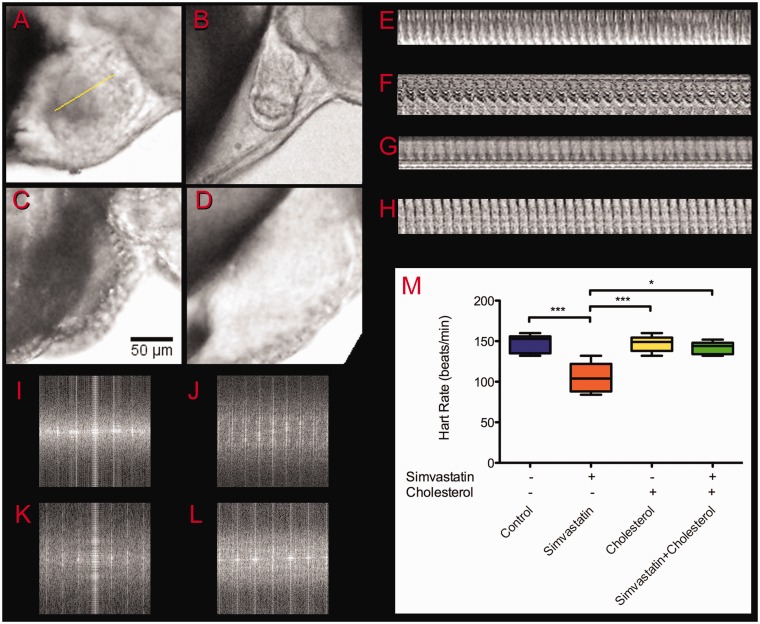
Figure 4.
Heartbeat frequency analysis. The heartbeat of 48 hpf embryos was recorded after treatment in different conditions: control (a), simvastatin 0.3 nM (b), cholesterol alone (c), and simvastatin and cholesterol (d). To analyze the regularity of the beating, Z sections were cut along selected lines as shown in (a) and the kymograms were plotted for control (e), simvastatin 0.3 nM (f), cholesterol (g), and simvastatin and cholesterol (h). To calculate the frequency of the beating, we measured the distance of the first periodical spot in FFT analysis of control (i), simvastatin 0.3 nM (j), cholesterol (k), and simvastatin and cholesterol (l). The frequencies calculated from the videos were coincident with frequencies directly observed, plotted in (m). Scale bar in (c) corresponds to 50 µm. The average value for simvastatin is significantly different from all other conditions (P < 0.01; ANOVA), while no other condition is significantly different from any other. At least 10 embryos were used in each different experimental condition. (A color version of this figure is available in the online journal.)

