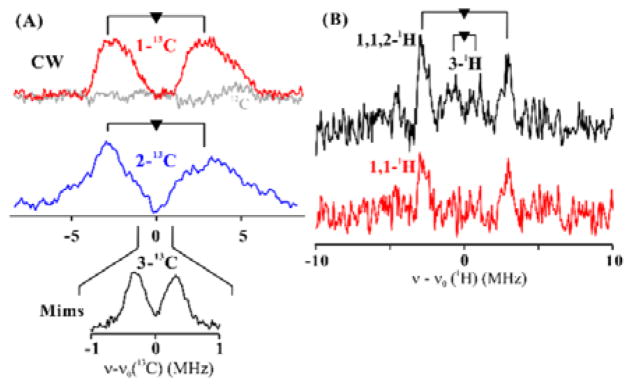
Figure 2.
(A) 35 GHz CW 13C ENDOR spectra for CA with 1-13C and 2-13C-labeled SAMCA collected at g2; the doublets are split by the hyperfine coupling, and centered at the Larmor frequency as described in SI. Inset: Mims ENDOR spectra of 3-13C SAMCA. (B) 1H Davies ENDOR difference spectra of CA generated by subtracting from the spectrum of 1H-SAMCA (natural abundance) the spectra for 1,1,2,3-2H-labeled SAMCA (upper) and 1,1-2H-labeled SAMCA (lower). Spectra were collected at g2 and normalized by EPR echo height.

