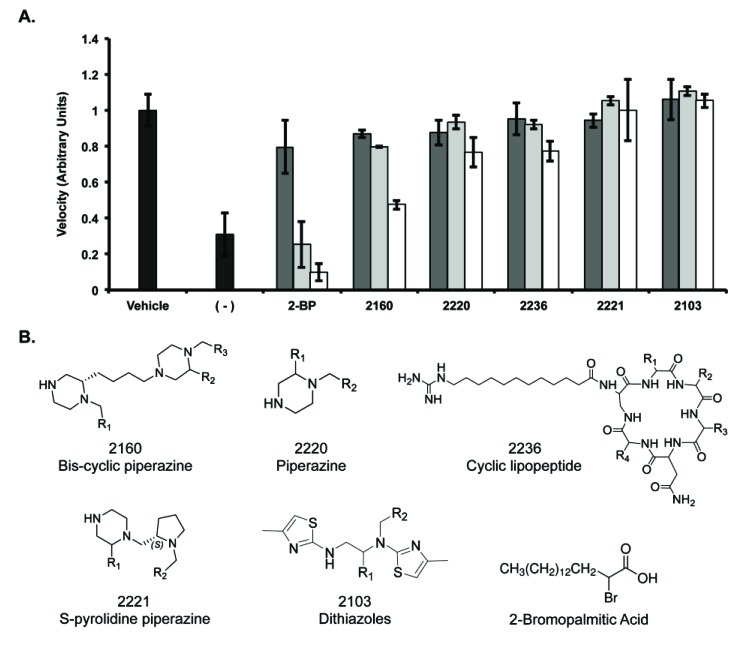
Fig. (3).
Inhibition of Erf2 auto-palmitoylation by varying the concentration of library samples. A, The velocity of Erf2 auto-palmitoylation on the coupled assay with the lead scaffold ranking library samples (2160, 2220, 2236, 2221, 2103). The velocity of Erf2 auto-palmitoylation was detected as an increase in fluorescence over time. Average values of three reactions are presented as a fraction of vehicle control (1% DMF) +/- standard deviation. Samples were screened at 50 μg/ml (dark grey bars), 100 μg/ml (light grey bars), and 200 μg/ml (white bars) compared to 2-BP at 50 μM (dark grey bars), 100 μM (light grey bars), and 200 μM (white bars). A reaction lacking Erf2 (-) represents baseline activity in the assay. B, Structures of lead scaffolds and 2-Bromopalmitic Acid. Positions for varying functional groups are denoted by R1-R4. Scaffold 2160 contains three R-group positions, scaffolds 2220, 2221, and 2103 each contain two R-group positions, and scaffold 2236 contains four R-group positions.

