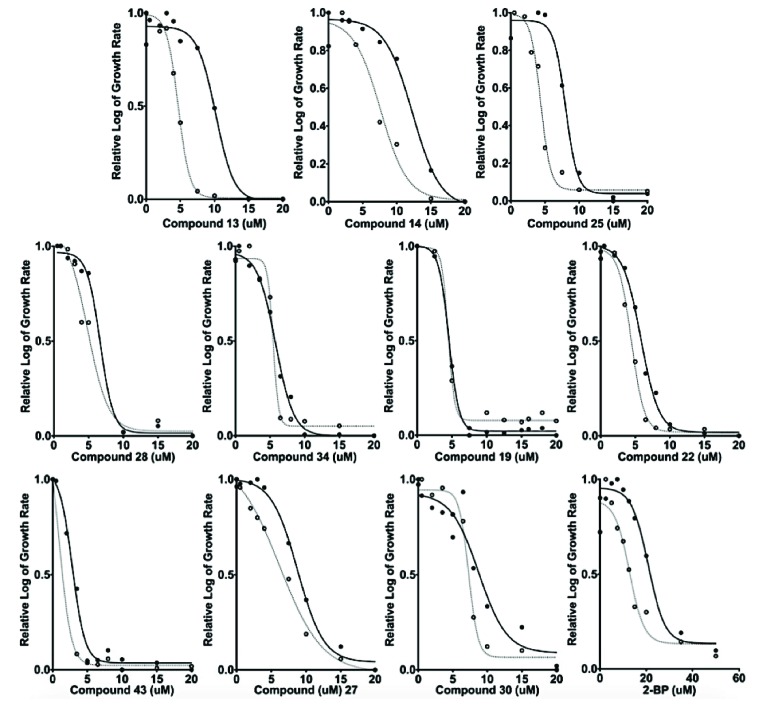
Fig. (9).
Inhibition of Ras palmitoylation-sensitized yeast. The EC50 for each of the individual compounds was established by graphing the logarithmic growth of S. cerevisiae strain, RJY1941 (solid lines and solid circles) and RJY1942 (hashed lines and open circles), versus the concentration of each compound. The curves were used to estimate the EC50 values are presented for 2-BP and the ten compounds identified in this study. Values were normalized to visually compare relative log of the growth rate of each compound and 2-BP.

