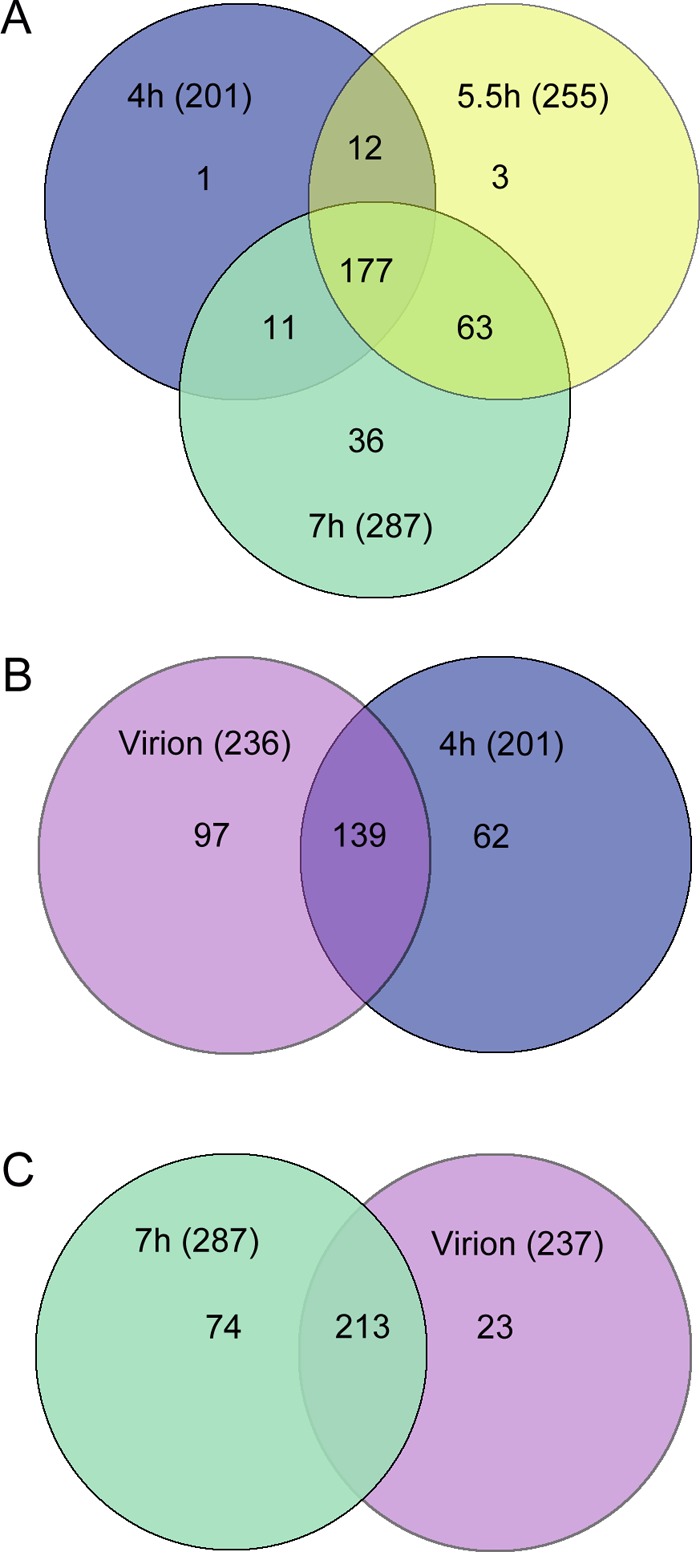
FIG 4.

Venn diagrams depicting protein content in mimivirus factories and in mature virions. (A) Proteins detected in isolated viral factories at 4, 5.5, and 7 h p.i. (blue, yellow, and green circles, respectively). The diagram demonstrates that the compositions of viral factories along the infection cycle differ substantially, thus underscoring the dynamic nature of these virus-generated organelles. (B) Relations between proteins detected in mature virions and proteins present in viral factories at 4 h (magenta and blue circles, respectively). (C) Relations between proteins detected in viral factories at 7 h and proteins found in mature virions (green and magenta circles, respectively). This diagram reveals that many proteins were present in the factories but not included in mature virions, implying that these proteins act as part of a production line, on par with the notion that viral factories represent intracellular organelles where vigorous viral assembly occurs.
