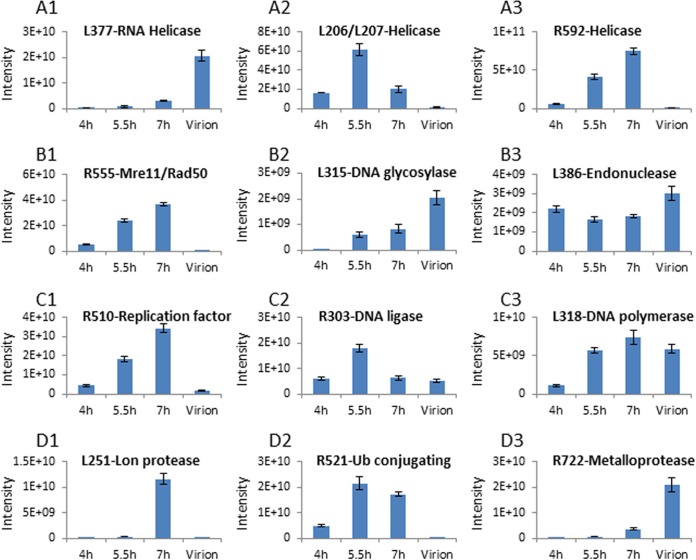
FIG 5.
Dynamic composition of the mimivirus cytoplasmic factories. (A1 to A3) Distribution of three helicases in viral factories and mature viral particles. (B1 to B3) Distribution of DNA repair proteins in viral factories and in mature viral particles. (C1 to C3) Distribution of DNA-replication-related proteins. (D1 to D3) Distribution of protein-degradation-related proteins. Intensities represent relative protein amounts. The figure highlights the fact that the relative amounts of proteins belonging to similar functional groups in viral factories substantially differ at progressive postinfection time points, as well as in mature virions.

