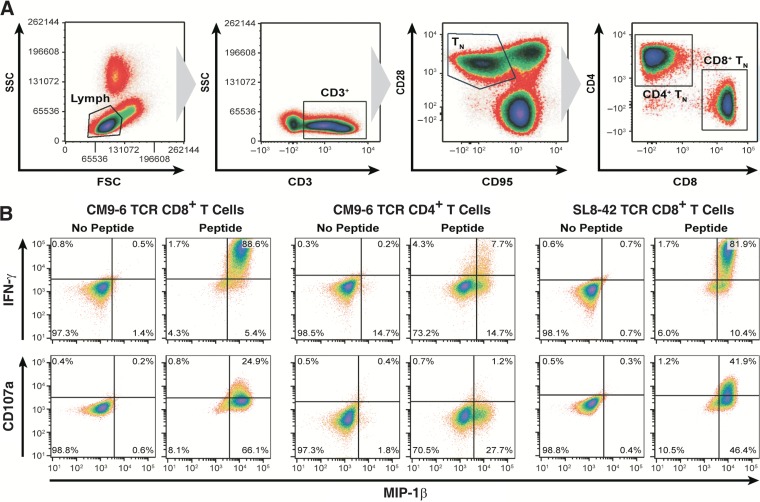
FIG 1.
Characterization of SIV-specific TCR transductants. (A) Plots of flow cytometric sorting (presented left to right) for naive T (TN) cells from rhesus macaque PBMC for lymphocytes based on size and granularity determined by side scatter and forward scatter (SSC and FSC, respectively), for naive T cells by CD3+/CD28+/CD95−, and for CD8+ and CD4+ T-cell populations are displayed. (B) Results of flow cytometric analysis of TCR-transduced Exp-2 cells for induction of surface CD107a and intracellular induction of IFN-γ and MIP-1β expression 6 h after coculture with PBMC pulsed with cognate peptides are displayed. Data are representative of results of two independent experiments. The data shown are from transduced Exp-2 cells; Exp-1 exhibited a similar profile (data not shown).

