
FIG 4.
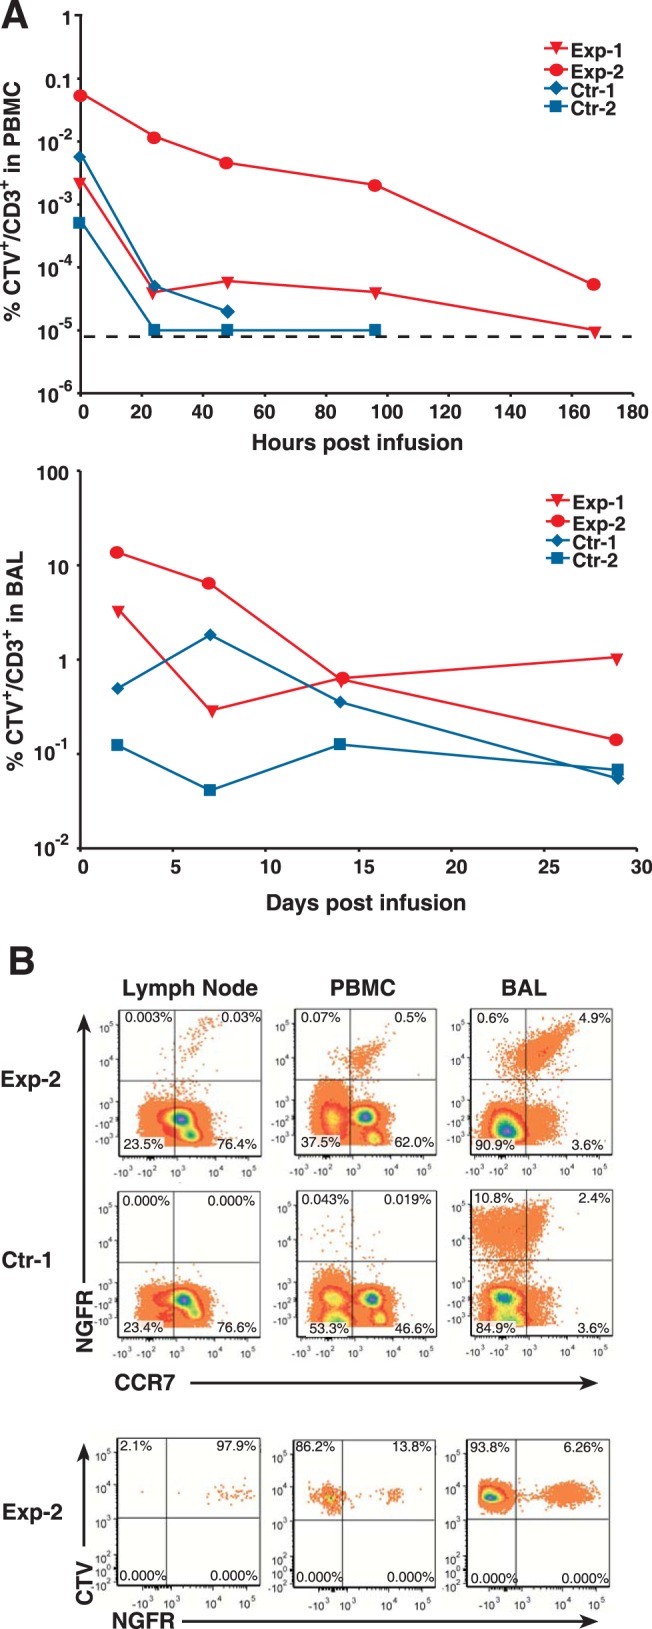
Persistence of infused T cells. (A) Graphs of the percentages of infused T cells (CTV+ CD3+) in blood (PBMC, top) or bronchiolar alveolar lavage fluid (BAL, bottom) samples measured by flow cytometry are presented. A dashed line indicates the level of detection in the flow cytometry assay. (B) Results of flow cytometry analysis for (top) CCR7 and NGFR expressing cells and (bottom) CTV+-gated NGFR expressing infused cells in blood and tissues 48 h postinfusion are presented.