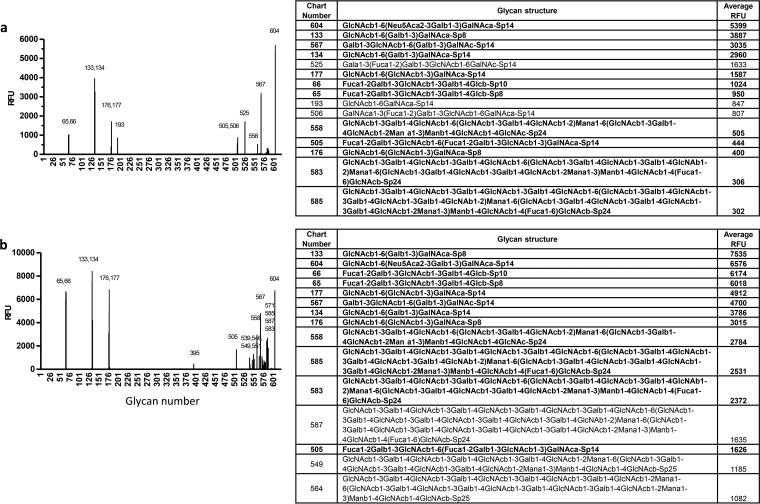
FIG 10.
P[10] from P[I] showed a glycan binding pattern similar to that of P[19] VP8*. A glycan array analysis was performed for P[10] in comparison with P[19]. Relative fluorescent units (RFU) of GST-VP8* at 200 μg/ml binding to 610 glycans are shown, where RFU corresponds to the strength of binding to individual glycans. The identities of the 610 glycans in the array are available at http://www.functionalglycomics.org/static/consortium/resources/resourcecoreh17.shtml. The P[10] VP8* (b) revealed a binding profile similar, with a dozen identical, highly reactive glycans, to that of P[19] VP8* (a). The top 15 ranked glycans for each of the two genotypes are shown on the right. Thirteen of the 15 glycans (in bold) were shared by P[19] and P[10]. The error bars represent the standard deviations from four replicate wells.

