FIG 6.
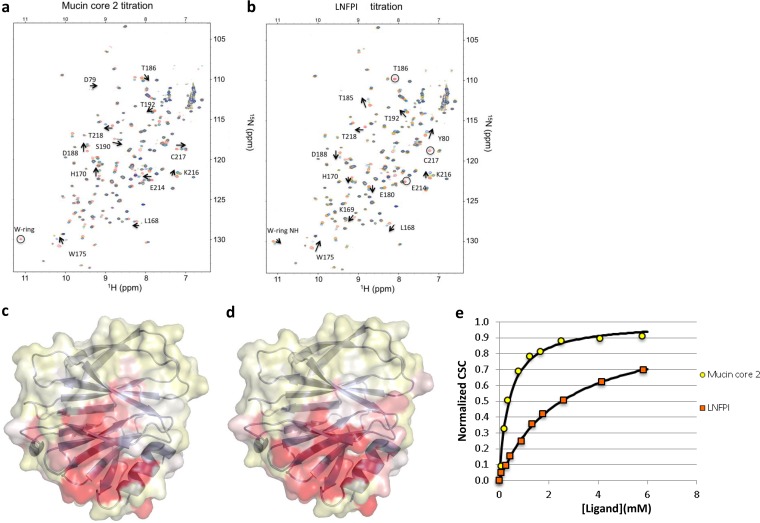
Chemical shift changes in P[19] VP8* upon addition of mucin core 2 (a) or LNFPI (b). Titrations were followed by acquisition of two-dimensional 1H-15N HSQC spectra of 0.25 mM 15N-labeled P[19] VP8* in Tris buffer collected at 20°C on a Bruker Avance III 600-MHz NMR spectrometer. The NMR data correspond to increasing ligand/protein ratios of 0:1 (red), 2:1 (orange), 8:1 (green), and 30:1 (blue). Peaks that disappeared upon titration are circled. Surface representation of the HN chemical shift changes for P[19] VP8* with mucin core 2 (c) and LNFPI (d) is also shown. The data were plotted onto the surface of a P[19] VP8* homology model, with the largest changes in dark red. The chemical shift differences between 1H and 15N resonances in free and ligand-bound proteins were determined as the weighted chemical shift change. For LNFPI, three HN cross-peaks disappeared upon ligand titration and did not reappear at higher ligand concentrations. These residues, T186, E214, and C217, were set at a maximum Δδav of 0.25. The 2D 1H-15N HSQC with a ligand/protein ratio of 30:1 was used for the bound shifts. The protein structure of P[19] VP8* was based on a homology model using the crystal structure of DS1 (a P[4] RV; PDB ID 2AEN) as the template and marked by using the Pymol program. (e) Plot of normalized chemical shift changes (CSC/CSC-max) versus free ligand concentrations.

