FIG 1.
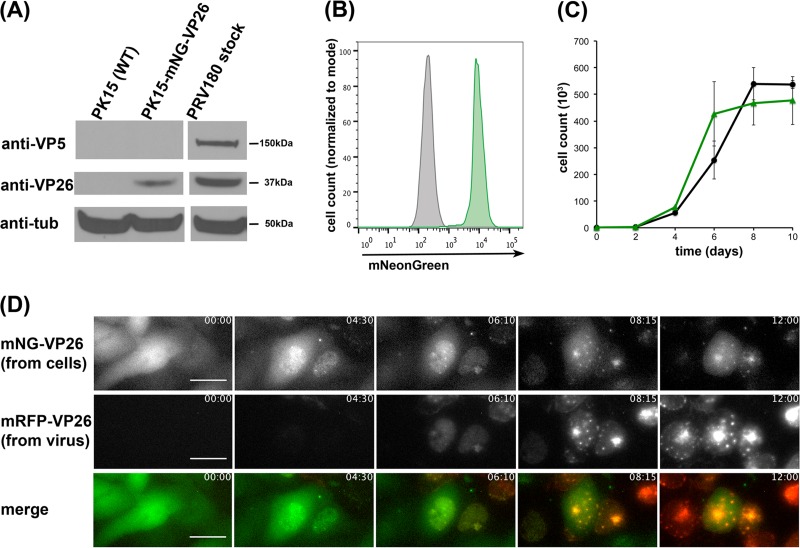
The clonal PK15-mNG-VP26 cell line stably expresses mNG-VP26. (A) Protein levels in lysates of wild-type (WT) PK15 cells and PK15-mNG-VP26 cells or the PRV180 virus stock were evaluated by immunoblotting using anti-VP26 (small capsid protein), anti-VP5 (large capsid protein), and anti-tubulin (anti-tub) antibodies. (B) Flow cytometry profiles of wild-type PK15 (gray) and PK15-mNG-VP26 (green) cells indicate two separate, homogenous cell populations based on mNeonGreen expression. At least 5,000 cells were analyzed under each condition. (C) Cell growth curve analysis of wild-type PK15 (black) and PK15-mNG-VP26 (green) cells shows similar growth rates through confluence. (D) Single frames of continuous image acquisition following PRV180 infection of PK15-mNG-VP26 cells over 12 h. Note the onset of mNG-VP26 nuclear localization prior to mRFP-VP26 detection and the colocalization of both signals in intranuclear assemblon structures. Importantly, most cells lose their green fluorescence signal within 6 to 8 h p.i. Bar, 25 μm. The time stamp shows hours:minutes. (Also see Movie S1 in the supplemental material.)

