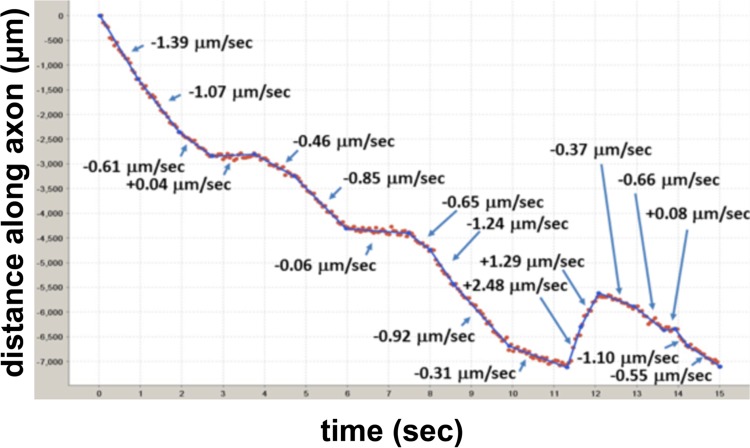
FIG 4.
Particle tracking and segment analysis of axonal PRV particles. The locations of the capsid were determined in each frame by Gaussian fitting (red dots). These data were then used to extract individual tracks for each particle, which were then parsed into segments of a constant velocity (blue lines). Representative capsid movement during entry in a Campenot chamber is shown. Negative values indicate motility in the retrograde direction.

