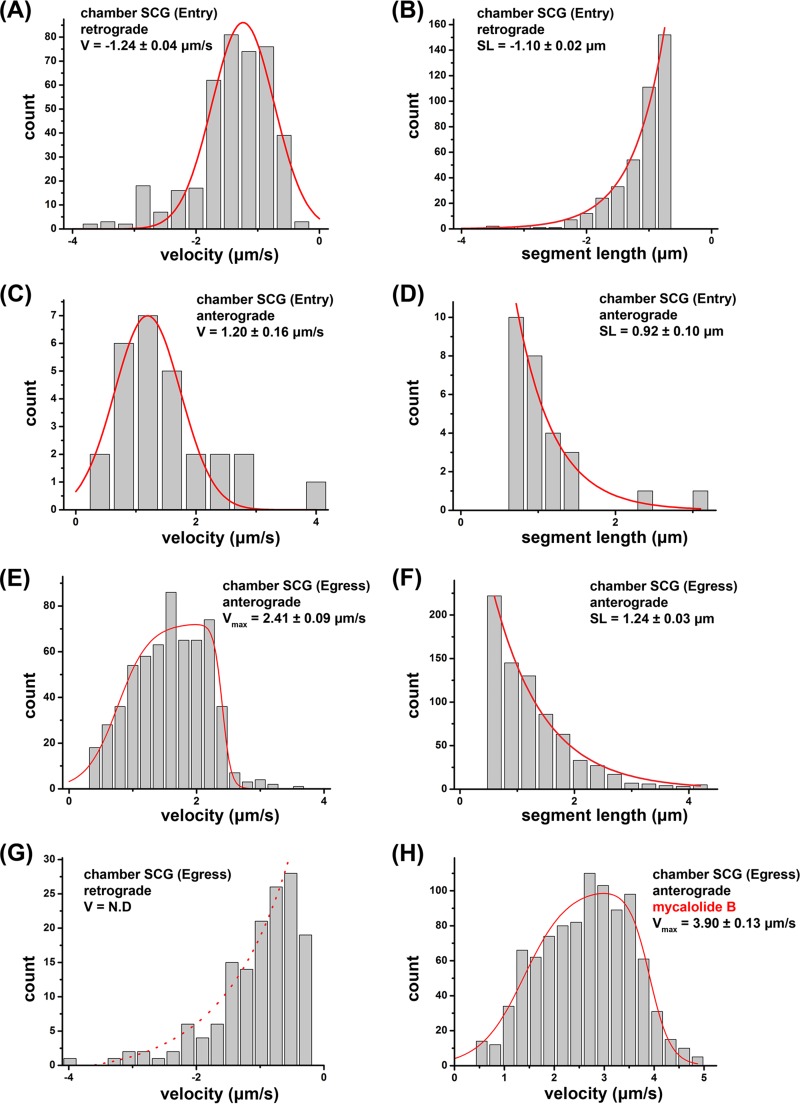
FIG 5.
High-resolution motility analysis of PRV180G in SCG cultures in Campenot chambers. After infection of SCG cultures, PRV180G capsids were tracked at high temporal and spatial resolutions (18.7 fps and 25 nm, respectively), and capsid velocity (V) and segment length (SL) were analyzed in an automated fashion (Fig. 4). (A to D) During entry, retrograde movements show robust motility (A and B) but are opposed by anterograde movements (C and D). (E to G) During egress, only active anterograde motility is detectable (E and F), whereas retrograde movements represent passive diffusion (G). (H) Anterograde velocity of egressing particles is enhanced after treatment with 4 μM mycalolide B, which inhibits actin polymerization and dynein/dynactin function. In panels A and C, the Gaussian fit is in red, and fit modes ± SEM are reported. In panels B, D, F, and G, the exponential decay fit is in red, and decay lengths from the fit ± SEM are reported. In panels E and H, the asymmetric double sigmoidal fit is in red, which represents a phenomenological fit to capture the key features of the observed velocity distribution (gradual rise, plateau, and falloff). Values indicate the midpoints of the falloff (vmax) and 95% confidence intervals (estimated by bootstrap resampling). N.D indicates that no significant velocity peak was detectable.

