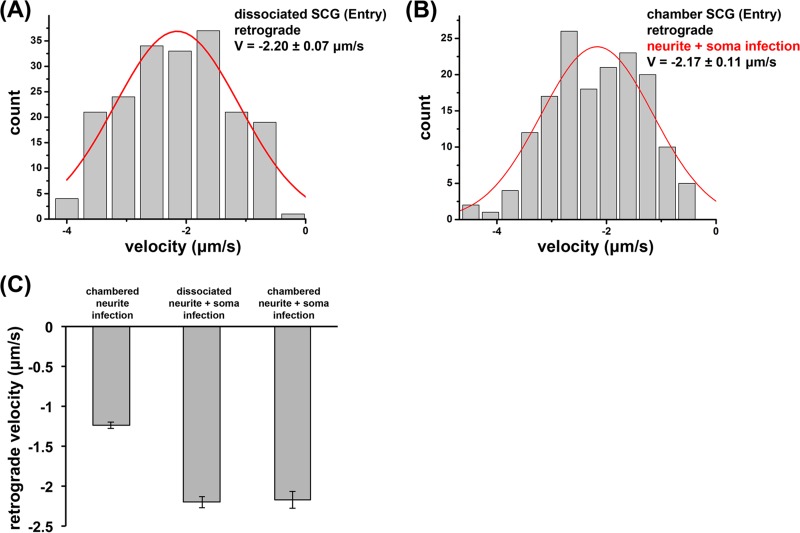
FIG 6.
Infection regimen affects retrograde axonal transport velocities of entering PRV180G capsids. (A and B) PRV180G capsids were tracked between 1 and 2 h p.i. at high temporal and spatial resolutions (18.7 fps and 25 nm, respectively), and the capsid velocity (V) was automatically analyzed in dissociated SCG cultures (A) or chambered SCG cultures where S and N compartments were infected simultaneously (B). Retrograde axonal transport velocities reached similar high levels. Gaussian fits are shown in red. Fit modes ± SEM are reported. (C) Bar graph summarizing average retrograde axonal transport velocities during entry in chambered and dissociated neurons. Exposure of the cell soma increases velocities ∼1.7-fold.

