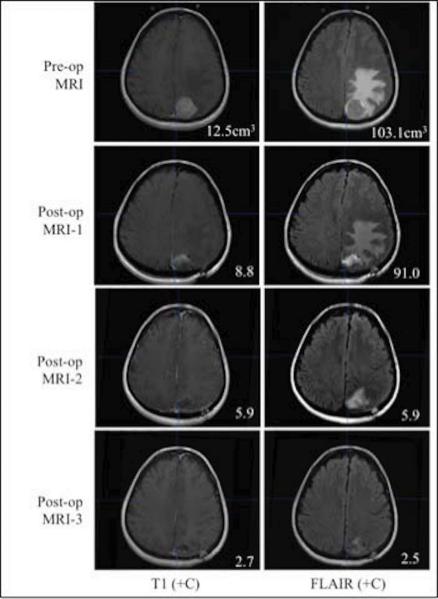
Figure 2.
This is an example of one patient's pre-operative and post-operative MRI series. This specific patient exhibited cavity collapse on T1+C throughout the entire follow-up period as well as a consistent decrease in edema volume visible on FLAIR. The numbers in the left column reflect tumor or cavity volumes (cm3), while the numbers in the right column are edema volumes (cm3) for this patient.

