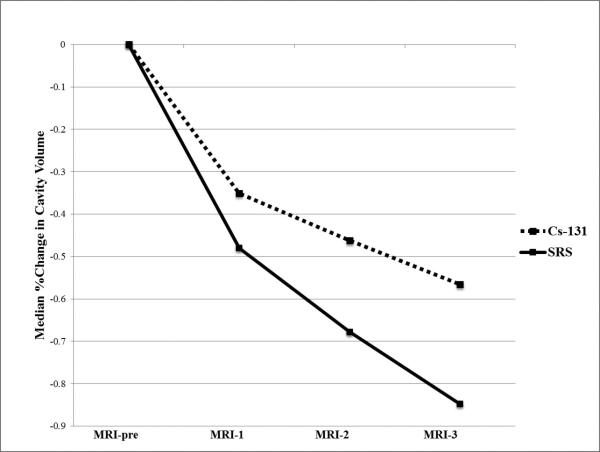
Figure 3.
This line graph demonstrates the trend of cavity volume shrinkage over the follow-up period in the Cs-131 versus SRS patient cohorts. Median percent change at each time point (MRI-1, 2, 3) refers to the percent change that occurred over the time period between pre-operative tumor volume (MRI-pre) and those end-points.

