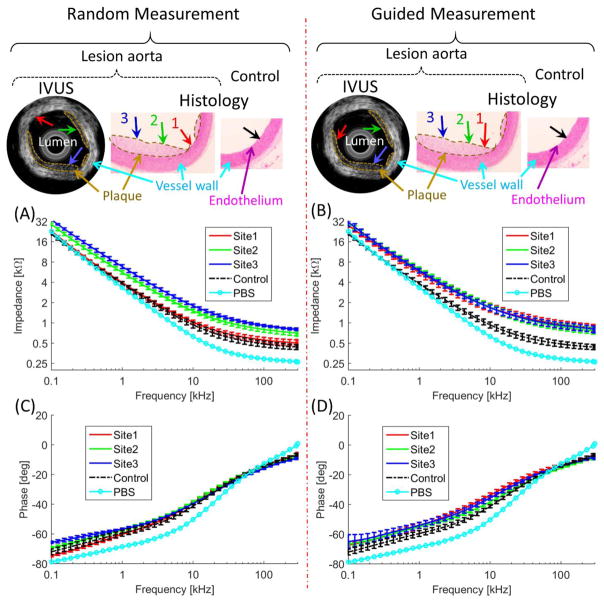
Figure 4.
Performances of the integrated transducer were demonstrated by comparing random (non-guided) and guided-measurements. Without the guidance, the EIS measurements at Site 1 missed the lesions (red arrow). With the IVUS guidance, EIS measurement sites were aligned with Sites 1, 2, and 3 (red, green, and blue arrow). (A) and (B) illustrated EIS measurement in terms of impedance magnitude, (C) and (D) the phase spectra. (A) Frequency-dependent impedance (kΩ) increased between 100 Hz to 300 kHz in the oxLDL-laden aorta (red, green, and blue) versus the lesion-free aorta (control, black). (B) With the IVUS guidance, the frequency-dependent impedance (red, green, and blue arrows) significantly increased between 100 Hz to 300 kHz as compared to the control (black). (C) The phase spectrum was indistinct in the random measurements from 100 Hz to 300 kHz. (D) With the guidance, the phase was distinct from the control at < 15 kHz.

