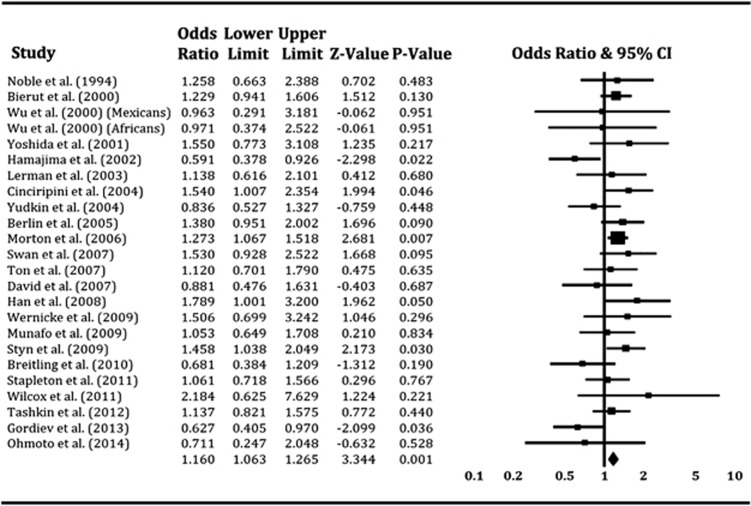
Figure 3.
Forest plot of the meta-analysis results for the association between Taq1A A1/* genotypes and smoking cessation across all studies. The Z-value and P-value of each eligible study are displayed by rows. The central vertical solid line stands for ORs that equal 1 for the null hypothesis. The OR and 95% CI of each study are represented by the square and horizontal bar, respectively. The pooled OR, which is represented by the diamond symbol underneath the forest plot was calculated under the fixed-effects model. CI, confidence interval; OR, odds ratio.

