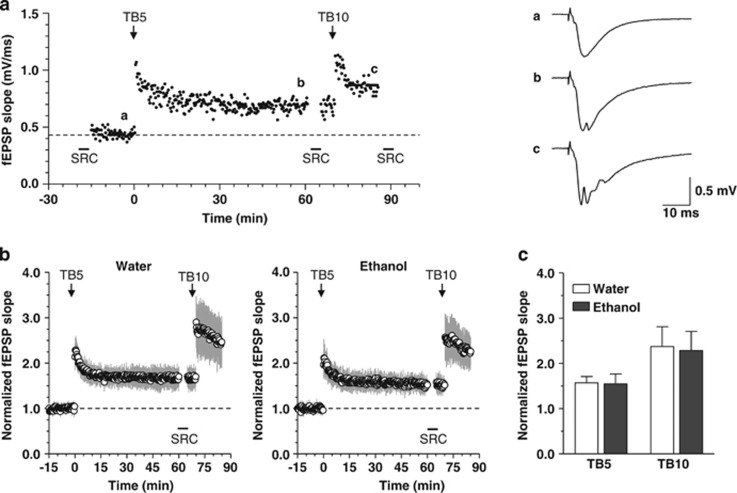
Figure 2.
Effects of ethanol intake on long-term potentiation (LTP) in the CA1 region of the hippocampus. (a, left) Illustration of a representative experiment of LTP recording. Time course of changes in field excitatory postsynaptic potentials (fEPSPs) induced by TB5 and TB10 stimulation and recorded from the CA1 region of a slice taken from a ‘water' mouse. After collection of a stimulus–response curve (SRC, not shown) at the time indicated by the black square, the stimulation strength of the test pulse was set to produce a synaptic response with initial slope equal to ~30% of the maximum and baseline responses were collected for 15 min. TB5 and TB10 stimuli were delivered at time points indicated by arrows. TB5 stimulation-induced LTP was followed for 60 min before a second SRC was collected. Then, test stimuli were delivered for 5 min before applying TB10 stimulation that was followed for a further 15 min. (a, right) fEPSP responses recorded at time points indicated by corresponding letters in left graph. Traces are averages of 21 consecutive responses (5 min) recorded at baseline (a) and after TB5 (b), and of 9 responses (2 min) after TB10 (c). Upward deflections appearing in the traces b and c are back-propagating action potentials generated in the somatic region of pyramidal neurons after LTP induction. Calibration bars apply to all traces. (b) Graphs show the time courses of fEPSP slope changes induced by TB5 and TB10 stimuli in mice drinking tap water (‘water', left graph, n=19) or ethanol (‘ethanol', right graph, n=15). Symbols represent the mean±s.d. of fEPSP slope in individual experiments, normalized to the last 5 min before TB5 stimulation delivered at time zero. (c) Comparison of the normalized fEPSP slope after TB5 and TB10 showed no statistically significant difference between ‘water' and ‘ethanol' mice. Each bar is the mean±s.d. of n=19 (water) and n=15 (ethanol) mice.

