Figure 4.
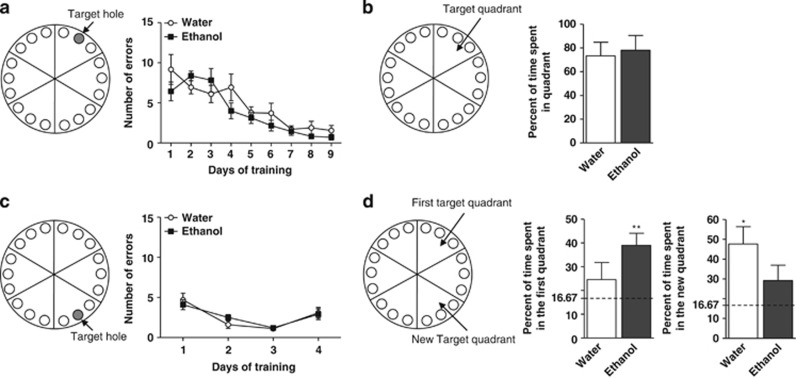
Effects of ethanol intake on spatial memory and cognitive flexibility. (a, left) Schematic representation of the Barnes test. Gray circle represents the escape box localized beneath the hole. (a, right) Mice were trained to learn the location of the escape box for 9 days with 2 sessions per day and the number of errors to reach the box (spatial memory) was recorded and plotted in function of the days. Each point is the mean±s.e.m. of n=10 (water) and n=9 (ethanol). (b, left) The circular platform was arbitrarily divided into six quadrants and the quadrant that contained the target hole was called the target quadrant. The escape box was removed and the mice were placed on the platform and allowed to explore during 30 s. (b, right) Percentage of time spent in the target quadrant during 30 s of the probe test. Each bar is the mean±s.e.m. of n=8 (water) and n=7 (ethanol) mice. (c, left) Reversal learning. The location of the escape box was moved 120° from the original location. (c, right) The reversal learning was monitored during 4 days with 3 sessions per day and the number of errors to reach the new target hole was recorded. Each point is the mean±s.e.m. of n=8 (water) and n=7 (ethanol). (d, left) The escape box was removed for the reversal probe test. Mice were placed on the platform and allowed to explore. (d, right) The percent of time spent in the new quadrant and in the first quadrant containing the original location of the escape box was analyzed during 30 s . Each bar is the mean±s.e.m. of n=8 (water) and n=6 (ethanol) mice, compared with the hypothetical value of 16.67; *P<0.05, **P<0.01, one-sample t-test.

