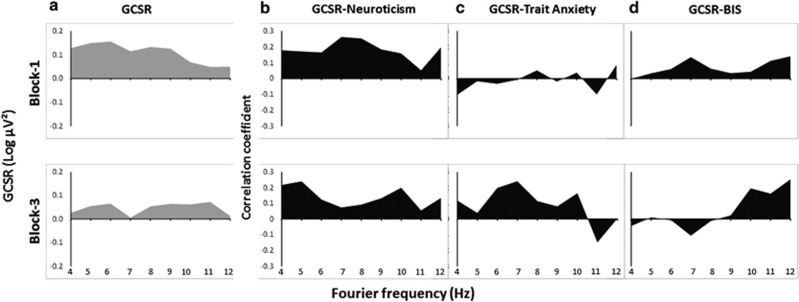
Figure 4.
(a) Variation in GCSR power with frequency at F8, averaged across all the participants. The value plotted was obtained by first subtracting power at the matching point in the preceding Go trial from power in the Stop trial and then taking this value for medium SSD trials and subtracting the average Stop–Go value for the short and long SSD trials. (b) Correlation between GCSR at F8 and neuroticism scores (EPQ-R). (c) Correlation between GCSR at F8 and trait anxiety scores. (d) Correlation between GCSR at F8 and BIS scores. BIS, behavioural inhibition system; GCSR, goal-conflict-specific rhythmicity; SSD, stop-signal delay.

