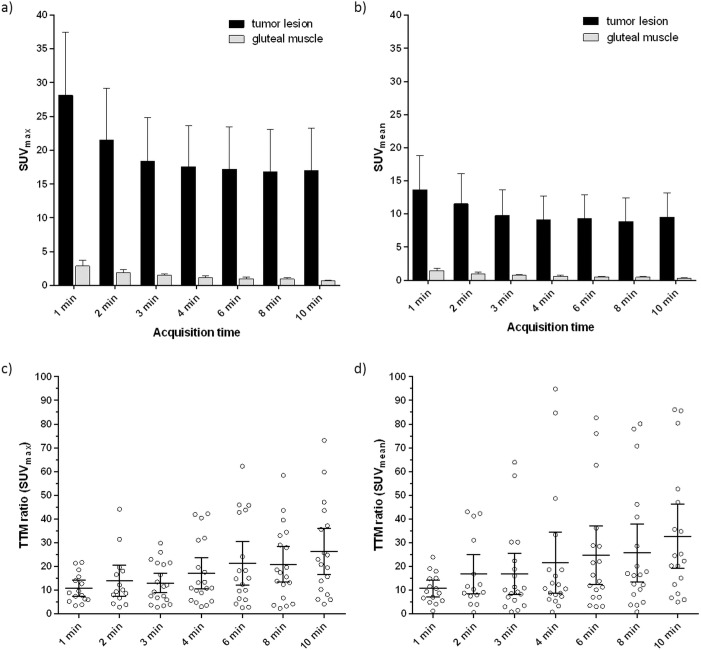
Fig 4.
SUVmax (a)) and SUVmean (b)) of tumor lesions and gluteal muscles at different PET acquisition times obtained with of 68Ga-HBED-CC-PSMA PET/MRI. SUVmax and SUVmean show a decreasing trend with increasing acquisition times, but remain stable at acquisition times of 4 min and later. Tumor-to-muscle (TTM) ratios at different acquisition time points based on SUVmax (c)) and SUVmean (d)) measurements. Data are represented in mean ± 95% confidence interval.

