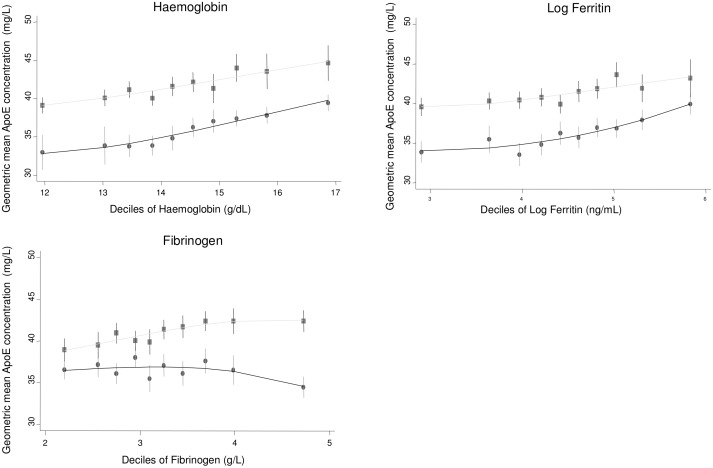
Fig 4. Cross-sectional association between geometric mean of ApoE concentration and haemoglobin, ferritin, and fibrinogen measured in ELSA, by gender.
Male (circles) and female (square) mean log ApoE concentration was calculated for each decile of the associated variable and plotted to visualise the shape of the association. Bars give 95% CIs.

