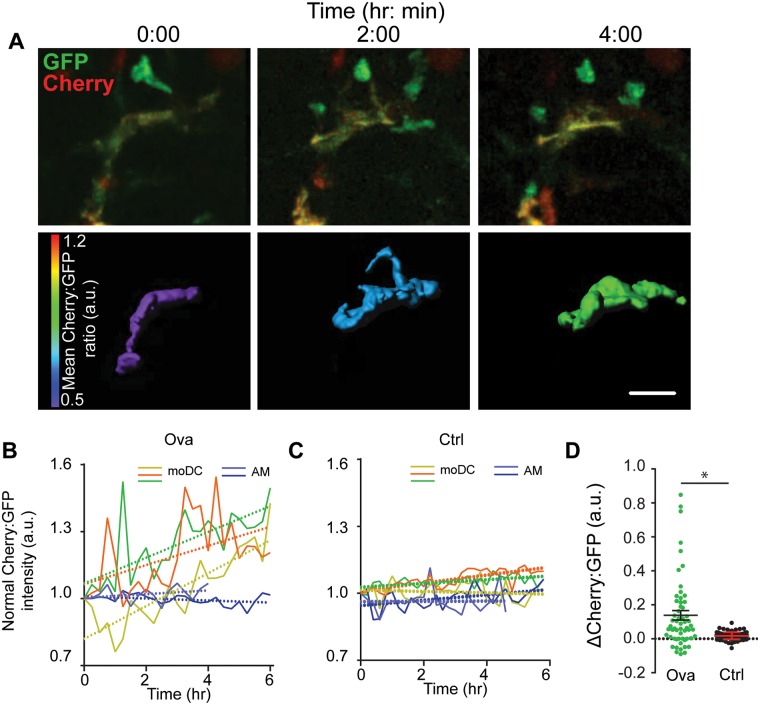
Fig 4. In situ maturation of CX3CR1+ monocyte-derived cells within inflamed lungs.
(A) Two-photon micrographs at three selected time points demonstrating in situ upregulation of the mCherry signal and thus advancement in red/green ratio. Top row shows an extended myeloid cell, showing Cherry (red) and GFP (green) channels. Bottom row shows rendered isosurfaces of the same cells, using a Cherry:GFP ratio-based color scale. Note: 0h is the beginning of imaging on day 24 of ova treatment. Scale bar = 20 μm. Also see Video 2. (B) Cherry:GFP ratio, normalized to the first frame, for 3 exemplar moDCs along with similar plots for 2 alveolar macrophages (AM) for comparison. Linear fits are shown by dotted lines, Each color represents an individual cell. (C) Similar plots for three cells taken from control lungs, also compared to exemplar AMs and showing reduced in situ maturation. (D) Plots of change in Cherry:GFP ratio normalized to AM intensity and time, for multiple cells studied in OVA-challenged and control lungs showing statistically significant p<0.05 differences in allergic lungs as compared to control. Data represent 3 independent experiments.

