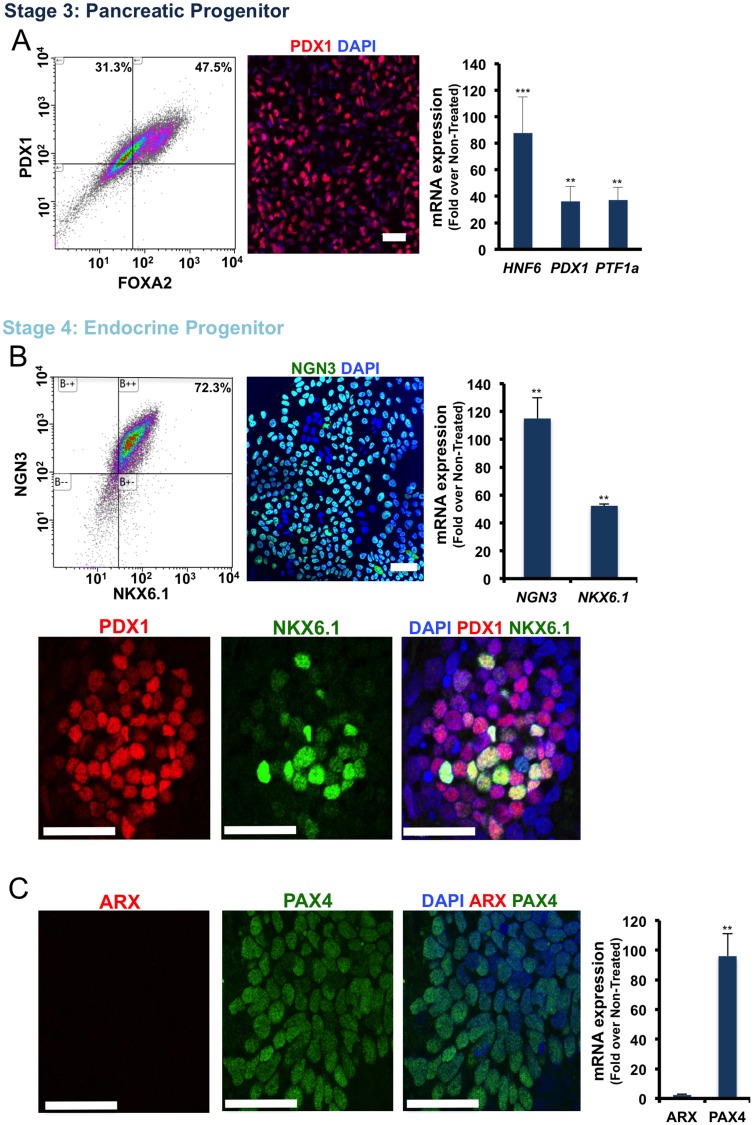
Fig 3. Characterization of the differentiated H1 ES cells at the Pancreatic Progenitor (PP) and the Endocrine Progenitor (EN) stages.
(A) From left to right, flow cytometry for PDX1/FOXA2, immunofluorescence staining for PDX1, and qRT-PCR analysis for the PP-specific genes in the differentiated cells at stage 3. (B) Flow cytometry for NGN3/NKX6.1, immunofluorescence staining for NGN3, qRT-PCR analysis for the EP-specific genes and below, immunofluorescence staining for PDX1/NKX6.1 in the differentiated cells at stage 4. (C) Immunofluorescence staining for ARX/PAX4, and qRT-PCR analysis for ARX and PAX4 in differentiated cells at the stage 4. Scale bar = 40μm. (*p< 0.05, **p< 0.01, p***<0.001, unpaired two-tailed t-test, n = 3).

