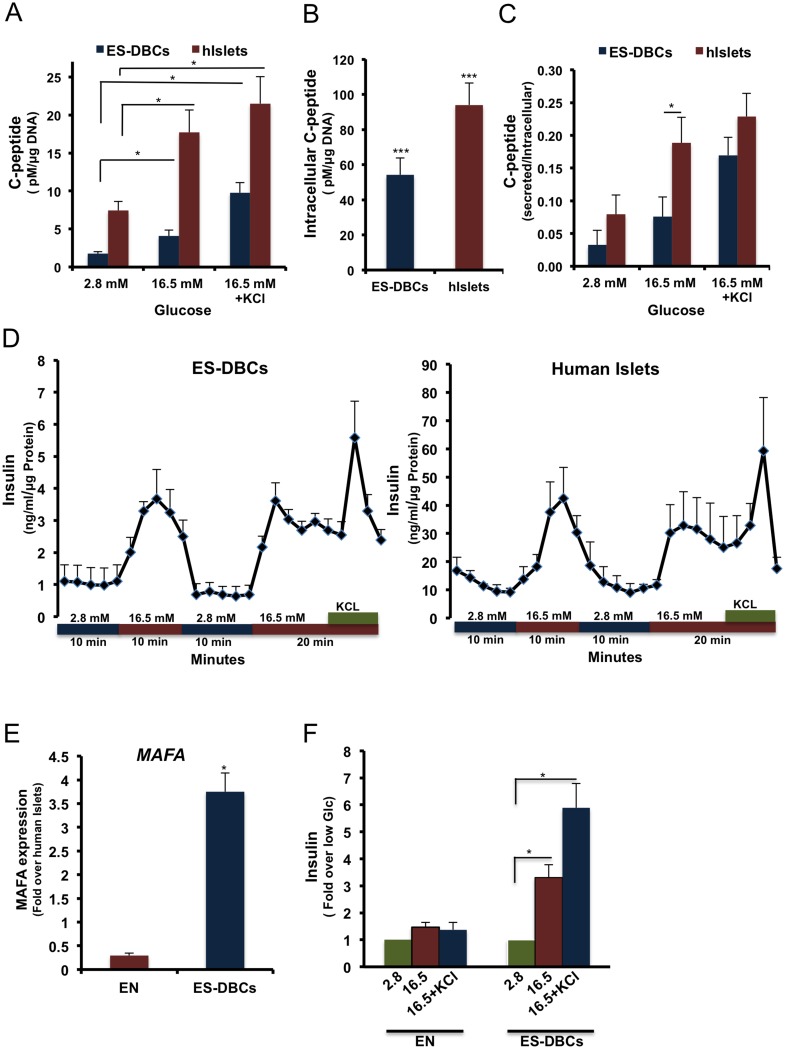
Fig 7. Examination of beta-cell stimulus-secretion coupling in human ES-DBCs vs. human islets.
(A) Measurement of C-peptide in the supernatant, and (B) lysates of H1 ES-DBCs and the human islets after stimulation by glucose. (C) Normalized secretion compared to intracellular C-peptide. (D) Temporal insulin secretion by perifusion in ES-DBCs and human islets. Correlation between (E) MAFA expression analyzed by qRT-PCR and (F) insulin secretion, in response to glucose stimulation in EN and ES-DBCs at stage 5. EN: ENdocrine cells as referred in Fig 1A. (*p< 0.05, **p< 0.01, p***<0.001, paired two-tailed t-test, n = 5).

