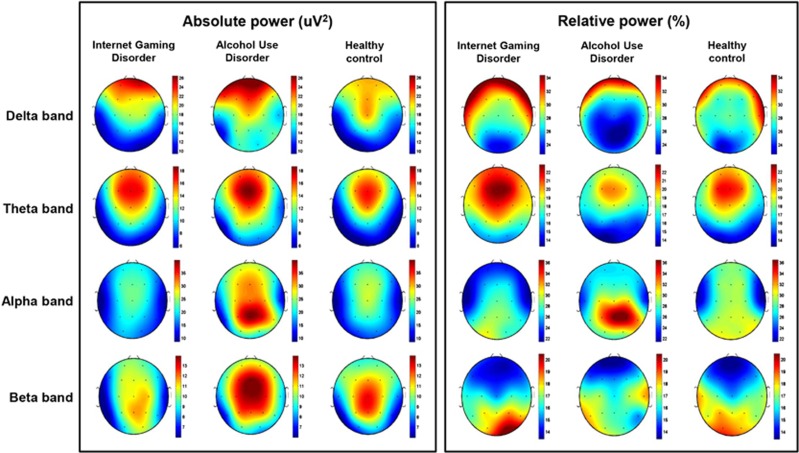
Figure 1.
Topographical maps of absolute and relative power in the Internet gaming disorder (IGD), alcohol use disorder (AUD) and healthy control groups. Scales show uV2 for absolute power and % for relative power. Red represents higher values and blue represents lower values. The IGD group demonstrated reduced absolute power in the beta band, compared with the AUD and healthy control groups. The AUD group demonstrated higher absolute power in the delta band compared with the IGD and healthy control groups. We found no significant main group effect in the relative power for all bands.

