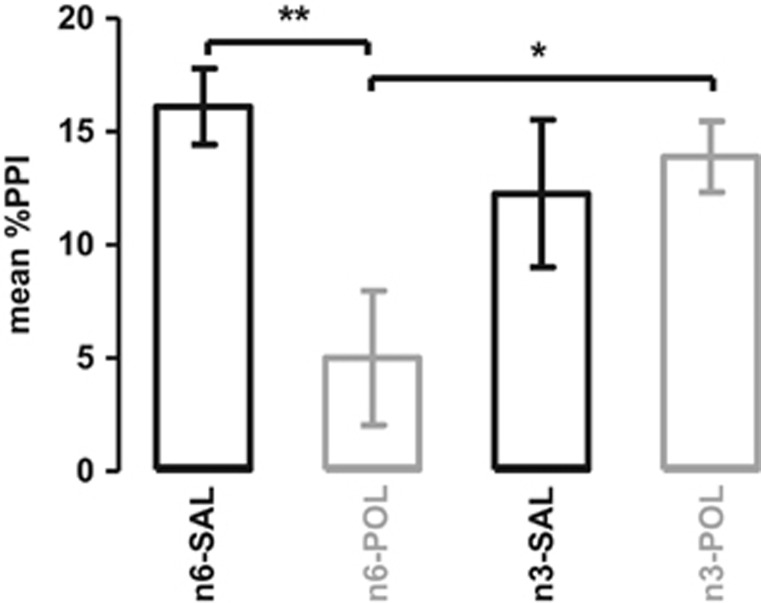
Figure 3.
Mean percentage prepulse inhibition (%PPI). The bar plot represents mean %PPI across all prepulse and pulse stimuli. All values are mean±s.e.m. *P<0.05, **P<0.01. Groups: n3-SAL, prenatal saline-exposed offspring treated with n-3 PUFA; n6-SAL, prenatal saline-exposed offspring treated with n6-polyunsaturated fatty acids (n-6 PUFA) control diet.

