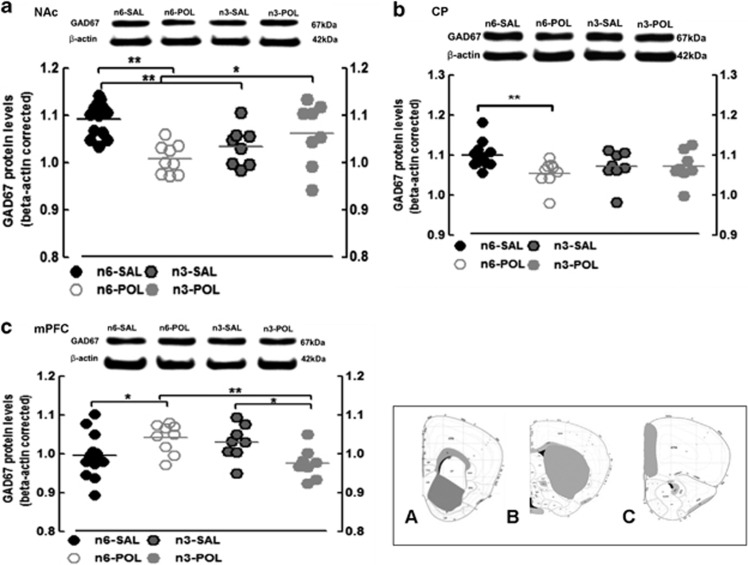
Figure 4.
GAD67 protein levels. (a) GAD67 protein level in nucleus accumbens (NAc), (b) caudate putamen (CP) and (c) medial prefrontal cortex (mPFC). β-actin is shown as a control for comparison. All values are mean±s.e.m. *P<0.05, **P<0.01. Histology panels represent coronal mouse atlas reference from Allen Institute,34 indicating regions-of-interest dissected for analyses (A=NAc, B=CP, C=mPFC). Groups: n6-POL, prenatal PolyI:C-exposed offspring treated with n-6 PUFA; n3-SAL, prenatal saline-exposed offspring treated with n-3 PUFA; n6-SAL, prenatal saline-exposed offspring treated with n6-polyunsaturated fatty acids (n-6 PUFA) control diet.

