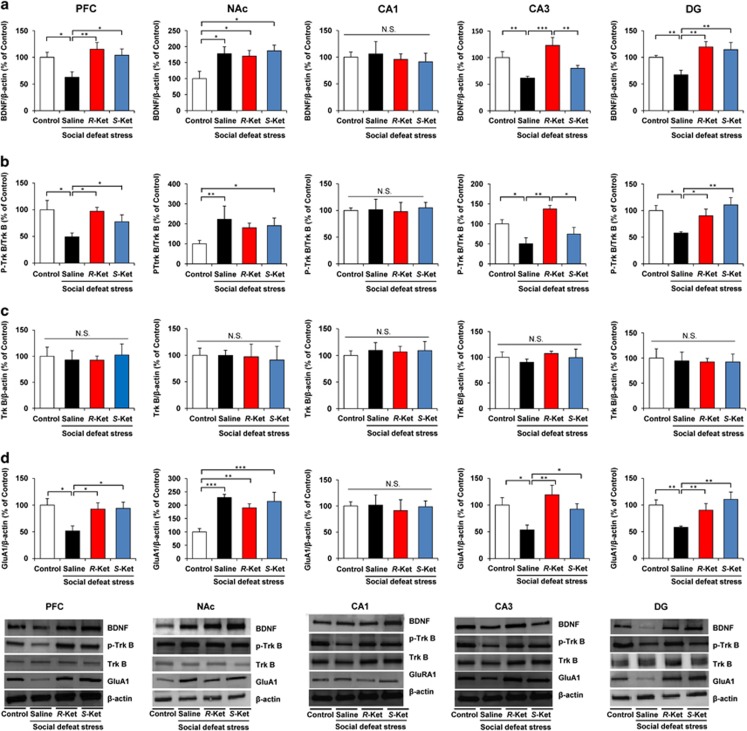
Figure 4.
Effect for R-ketamine and S-ketamine on the BDNF, TrkB phosphorylation and GluA1 in the brain regions. Brain samples were collected 7 days after a single dose of saline, R-ketamine (10 mg kg−1) or S-ketamine (10 mg kg−1) for Golgi–Cox staining. (a) Western blot analysis of BDNF in PFC, NAc, CA1, CA3 and DG. PFC (one-way ANOVA, F3,13=5.759, P=0.009); NAc (F3,13=3.544, P=0.045); CA1 (F3,14=0.065, P=0.978); CA3 (F3,13=8.324, P=0.002); DG (F3,13=7.444, P=0.003). The value was expressed as a percentage of that of control mice. Values represent the mean±s.e.m. (n=5 or 6). *P<0.05, **P<0.01, ***P<0.001. (b, c) Effects of R-ketamine and S-ketamine on changes in phosphorylation of TrkB in the mouse brain after social defeat stress. The ratio of p-TrkB to total TrkB in the brain regions was shown. PFC (one-way ANOVA, F3,13=3.962, P=0.033); NAc (F3,13=3.613, P=0.043); CA1 (F3,14=0.05, P=0.984); CA3 (F3,14=6.545, P=0.005); DG (F3,13=7.612, P=0.003). Total levels of TrkB protein in the all regions were not different among the four groups. Values represent the mean±s.e.m. (n=5 or 6). *P<0.05, **P<0.01. (d) Western blot analysis of GluA1 in PFC, NAc, CA1, CA3 and DG of the hippocampus. PFC (one-way ANOVA, F3,13=3.619, P=0.04); NAc (F3,14=7.834, P=0.003); CA1 (F3,14=0.060, P=0.98); CA3 (F3,14=5.207, P=0.013); DG (F3,14=5.108, P=0.014). The value was expressed as a percentage of that of control mice. Values represent the mean±s.e.m. (n=5 or 6). *P<0.05, **P<0.01, ***P<0.001. ANOVA, analysis of variance; BDNF, brain-derived neurotrophic factor; DG, dentate gyrus; NAc, nucleus accumbens; N.S., not significant; PFC, prefrontal cortex.

