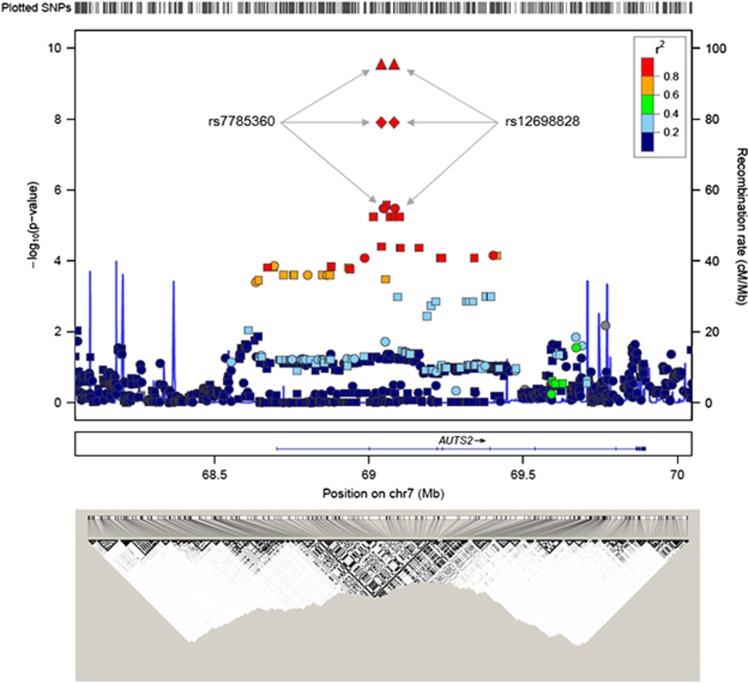
Figure 3.
Regional association plot. P-values (ordinate axis, upper panel) are from the Cochran–Armitage trend test in the discovery set (circles: genotyped single-nucleotide polymorphisms (SNPs) and squares: imputed SNPs) and combination set (diamonds: the discovery and replication sets, triangles: discovery, replication and cross-replication set) in upper panel. The blue lines indicate the recombination rates in cM per Mb estimated using HapMap samples (upper panel). A horizontal line indicates the location of the AUTS2 gene (middle panel). A linkage disequilibrium map based on r2 values was computed using the Hapmap JPT+CHB data (the International HapMap Project data, bottom panel).

