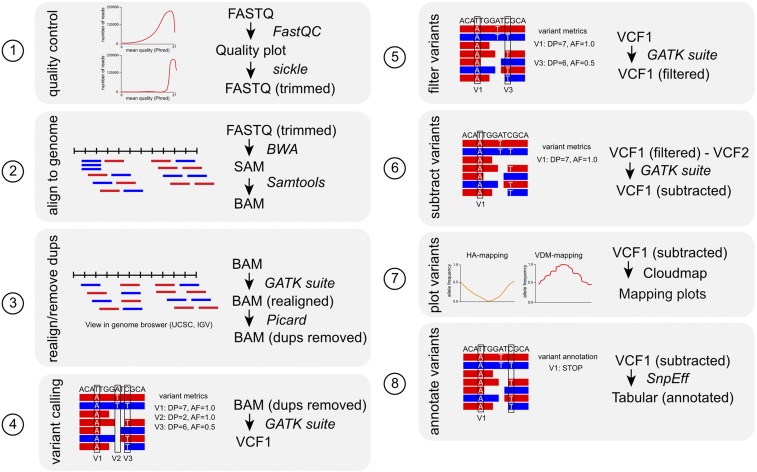
Figure 4.
A typical mapping-by-sequencing data analysis workflow. Schematic representation of the bioinformatics analysis steps (1–8) involved in analyzing the NGS data obtained from a mapping strain or population starting from raw FastQ files until a mapping interval and a candidate mutations list is generated. The file format is indicated for each step of the workflow. See Table 2 for links to the bioinformatics tools (FastQC, Sickle, BWA, Samtools, GATK suite, Picard, CloudMap, and SnpEff). Variant metrics or annotation are exemplified for steps 4–6, and 8. V1, V2, and V3 are variants. AF, allele frequency; DP, read depth; Dups, duplicates. For definitions of variant metrics, see Box 2.

