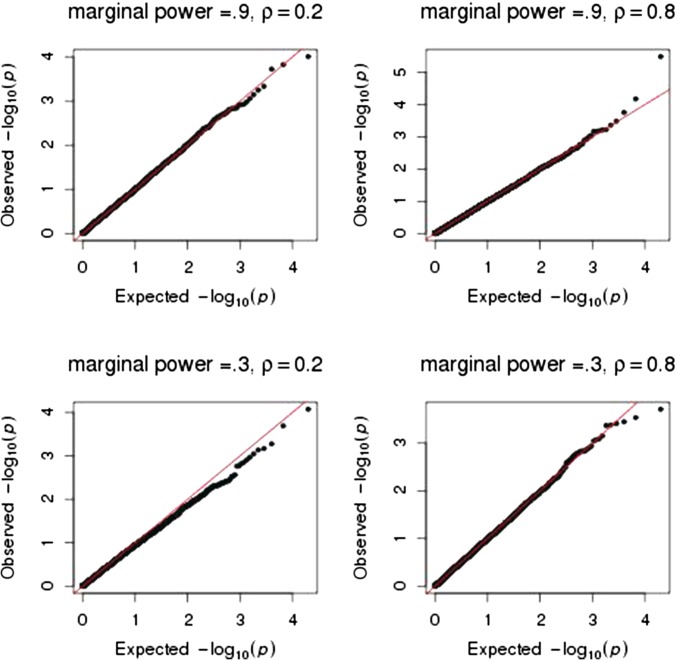
Figure 2 .
Quantile–quantile plots of P-values to test the null hypothesis of no pleiotropy. Sample size was 1000 with four equally correlated traits All but one was zero; the nonzero was chosen such that there was either 30% or 90% power to detect its marginal effect using A total of 10,000 simulations were performed.

