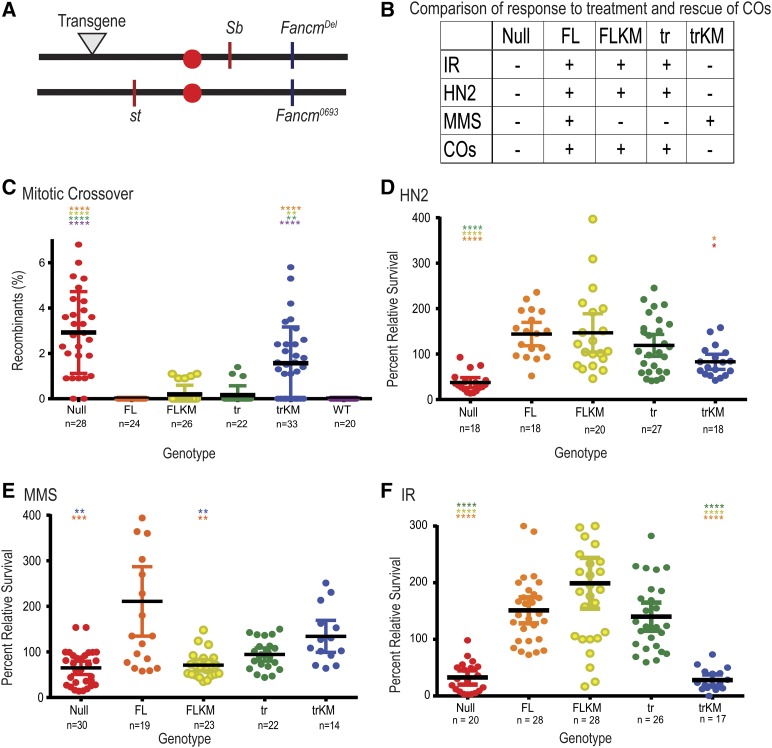
Figure 4.
Fancm has genetically separable functions. (A) Map of Fancm null allele (Fancm0693), CRISPR deletion (Fancmdel), transgene landing site (▾), and st and Sb genes. Schematic of transgenes generated are as seen in Figure 1A, without tags. (B) Table comparison of all transgenic Fancm genotypes and null genotype. − indicates no rescue of the null phenotype, + indicates rescue. (C) Spontaneous mitotic CO rates were measured between st and Sb. (D–F) Comparison of sensitivities of Fancm. Plots show the survival of the indicated phenotype relative to wild-type control flies in the same vial after exposure to (D) 0.002% HN2 (0.1 M), (E) 0.05% MMS (3.23 mM), or (F) IR (1500 rad). Red ●, null; Orange ●, FL; yellow ●, FLKM; green ●, tr, light blue ●, trKM; dark blue ●, wild type (WT). Each dot represents one vial, n measures number of vials. Mean percentage of progeny is represented by black horizontal bar. 95% C.I.s are represented by colored error bars. Statistical comparisons were done for Fancm compared to each other genotype. Statistically significant comparisons are indicated above error bars; **** P < 0.0001 by Kruskal–Wallace test, corrected for multiple comparisons.

