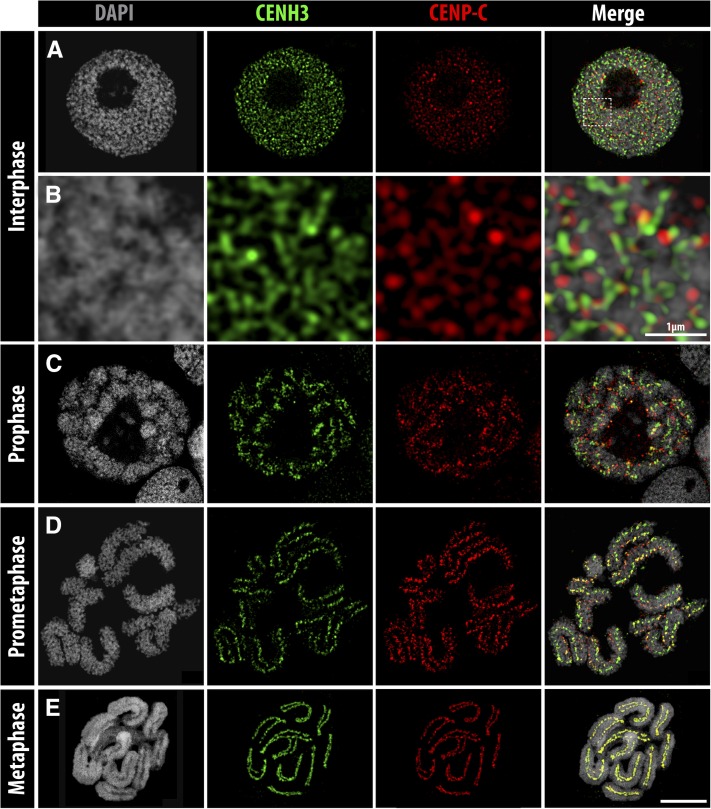
Figure 2.
CENH3 and CENP-C distribution during the mitotic cell cycle of R. pubera, obtained from tapetum cells. (A and B) Interphase, (B) enlargement of A (squared), (C) prophase, (D) prometaphase, and (E) metaphase. Colocalized CENH3 and CENP-C signals are visible in yellow in the merge images. Bar, 5 µm, except when indicated.

