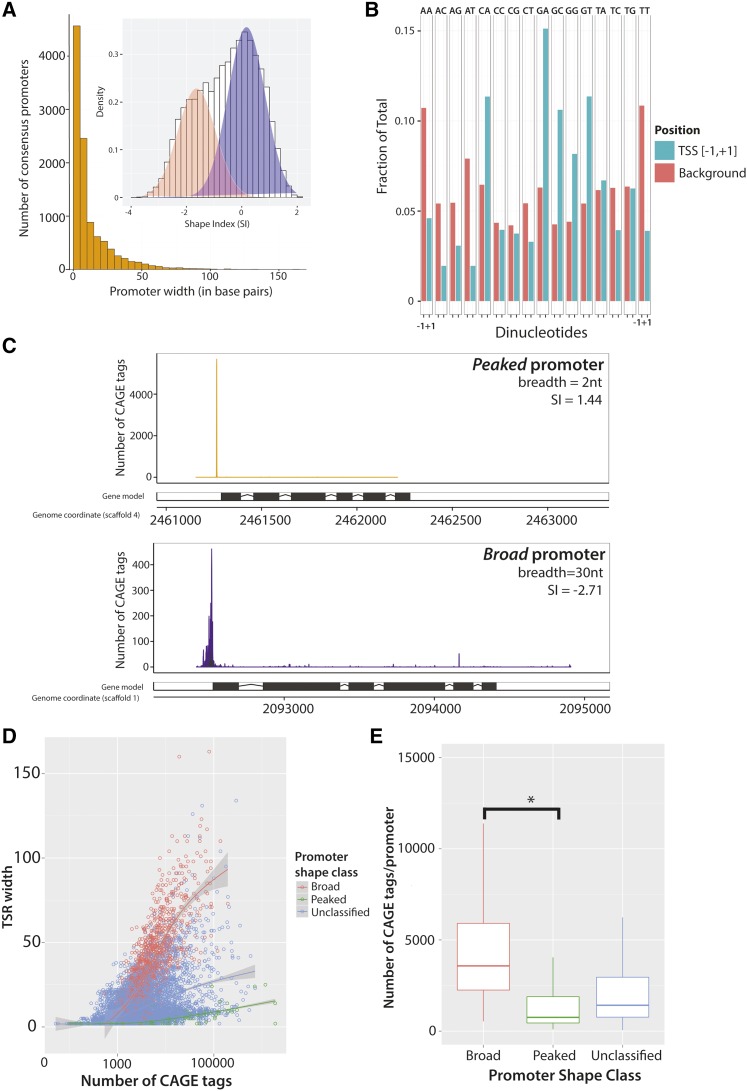
Figure 2.
Distributions of consensus promoter width and shape in the D. pulex promoter atlas. (A) A histogram representing the distribution of calculated consensus promoter (n = 10,580) widths is shown in orange (outer figure). Each bin width represents 5 bp. Inset: Consensus promoter shapes have a bimodal distribution. A histogram representing the shapes (measured with the SI) of all consensus promoters (n = 10,580) is shown in white, with each bin indicating 0.1 of a SI. The densities of broad (coral) and peaked (purple) consensus promoter shapes were fitted from the overall distribution of SI values (see Materials and Methods). (B) Distinct dinucleotide preferences at transcription initiation sites in D. pulex. The dinucleotide frequencies at CTSSs ([−1,+1]; aqua) are compared to background (coral). CTSSs show a twofold or greater preference for the dinucleotides CA, GA, GC, and GT, and are similarly depleted for AA, AT, and TT. (C) Representative examples of canonical CAGE tag distribution patterns observed in D. pulex consensus promoters. Peaked consensus promoters (above) exhibit narrow CAGE tag distributions, whereas broad consensus promoters (below) are typified by more a dispersed distribution of CAGE tags. (D) Consensus promoter activity correlates with shape more strongly than width. Consensus promoter activity (measured according to total number of CAGE tags) is plotted against TSR width in base pairs bp. Peaked (SI > 1), broad (SI < −1.5) and unclassified (all other) consensus promoters are identified by green, red, and blue circles, respectively. (E) Broad consensus promoters have greater activity than peaked consensus promoters. A significantly greater number of CAGE tags are observed in broad consensus promoters relative to peaked consensus promoters (* P < 0.0005; Tukey’s HSD). Box-and-whisker plots representing the distributions of the consensus promoter activity in three shape classes (broad, red; peaked, green; and unclassified, blue) are shown. CAGE, Cap Analysis of Gene Expression; CTSS, CAGE-detected TSS; HSD, honest significant difference; SI, Shape Index; TSR, transcription start region.

