Figure 6.
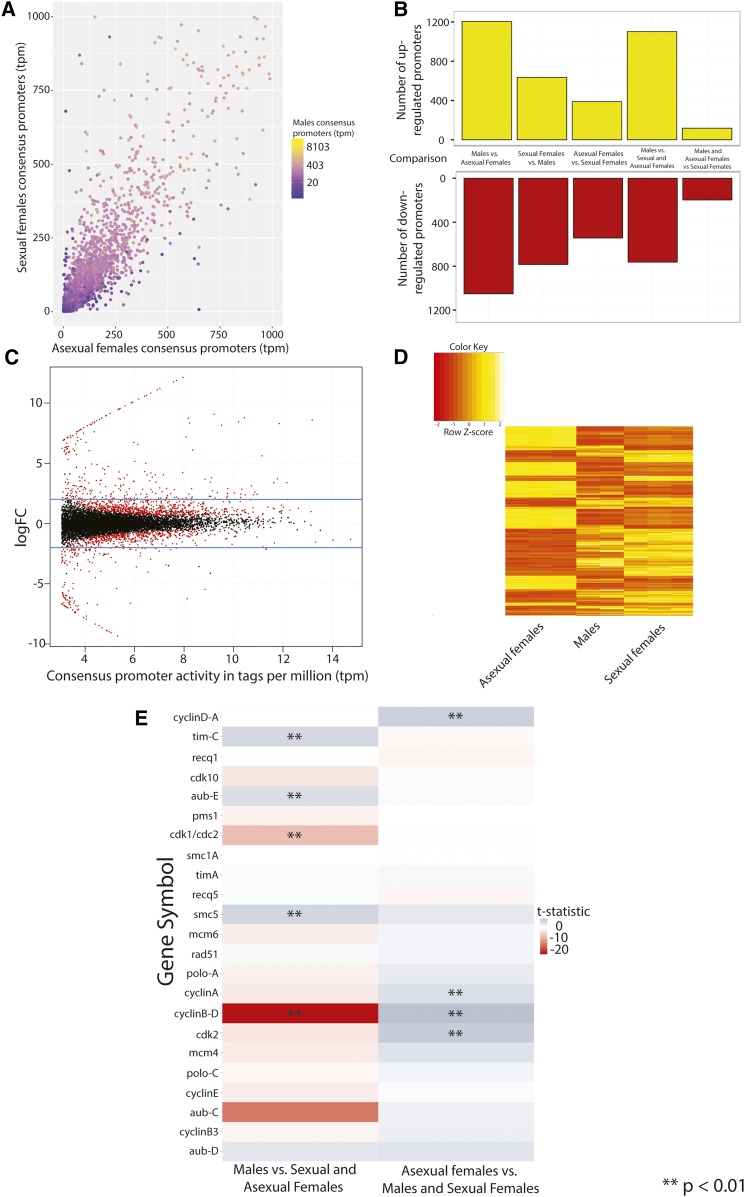
Analysis of differential activity of D. pulex consensus promoters. (A) Representation of consensus promoter activities among the states surveyed in this study. A scatterplot of consensus promoter activity (in tpm) within all three states measured within our study is shown, with the value for asexual females (x-axis) plotted against sexual females (y-axis). Corresponding promoter activity values for males are represented according to a color gradient in log-scale. A small number of consensus promoters (n = 145) that lie outside the area of the plot are not shown. (B) Barplot of DA promoters between pairs of the states surveyed. (C) MA plot of consensus promoter activity within asexual compared to sexual females. MA activity of consensus promoters (x-axis) is plotted against the log FC of the ratio of the activity of consensus promoters between asexual females and sexual females (y-axis). DA consensus promoters (P < 0.01 are represented by red dots; all others are colored in black. Top and bottom blue lines on the plot indicate the log(FC) of 2 and −2, respectively. (D) Heatmap of the activities of DA (P < 0.01) consensus promoters between asexual females and sexual females. (E) Heatmap grid of relative activity of consensus promoters of D. pulex meiosis genes within two selected comparisons: males vs. females and asexual females vs. sexuals. Cells are shaded according to the calculated t-statistic of a given comparison. Instances of significant differential activity (P < 0.01) are labeled with two asterisks (**). DA, differentially-active; fold-change, FC; MA, mean–average; tpm, tags per million.

