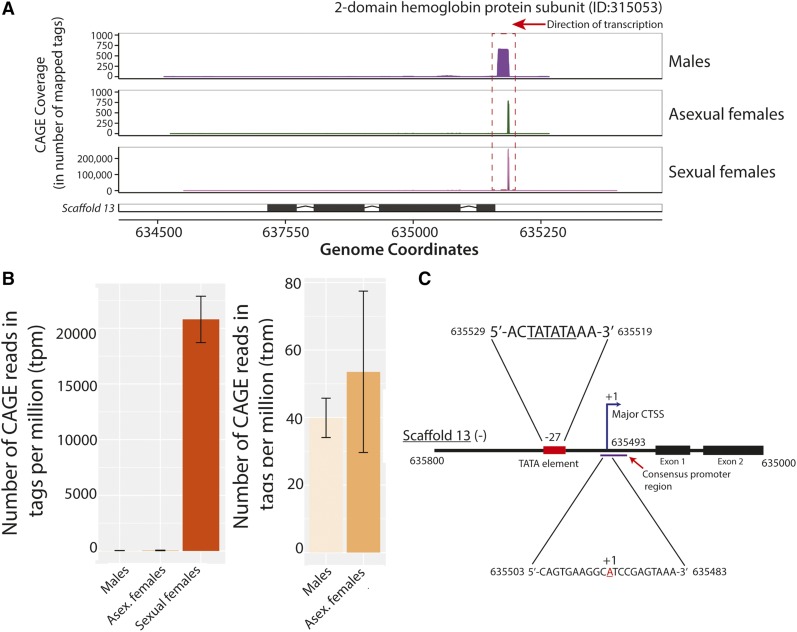
Figure 7.
Extreme upregulation observed at the putative promoter of a hemoglobin gene in D. pulex sexual females. (A). Mapped CAGE tags from each of the three surveyed states to an annotated hemoglobin gene (ID:315053) on scaffold 13 are shown. The frequency of CAGE tags observed at each genomic coordinate (x-axis) are indicated by the y-axes of each plot. Note that larger y-axis scales are applied for the sexual females plot due to the dramatically higher number of mapped CAGE tags observed at the same locus. (B) Consensus promoter activity (in tpm) at the same genomic locus as (A) across all three states is presented in the left panel; in the right panel only the values for males and asexual females are shown to provide perspective. The standard error of the mean of all replicates is shown for each individual plot. (C) Schematic illustration of the core and proximal promoter region of the hemoglobin gene (ID:315053). The major CTSS (+1) is identified by the blue arrow, and the TATA consensus sequence is represented by the red rectangle. The purple line represents the consensus promoter region identified by CAGE. The genomic coordinates for the sequences (all on scaffold 13) are shown in black. Note that the sequence for the negative strand is shown; the illustration was flipped to improve legibility. The drawing was not made to scale. CAGE, Cap Analysis of Gene Expression; CTSS, CAGE-detected TSS; tpm, tags per million.

