Figure 6.
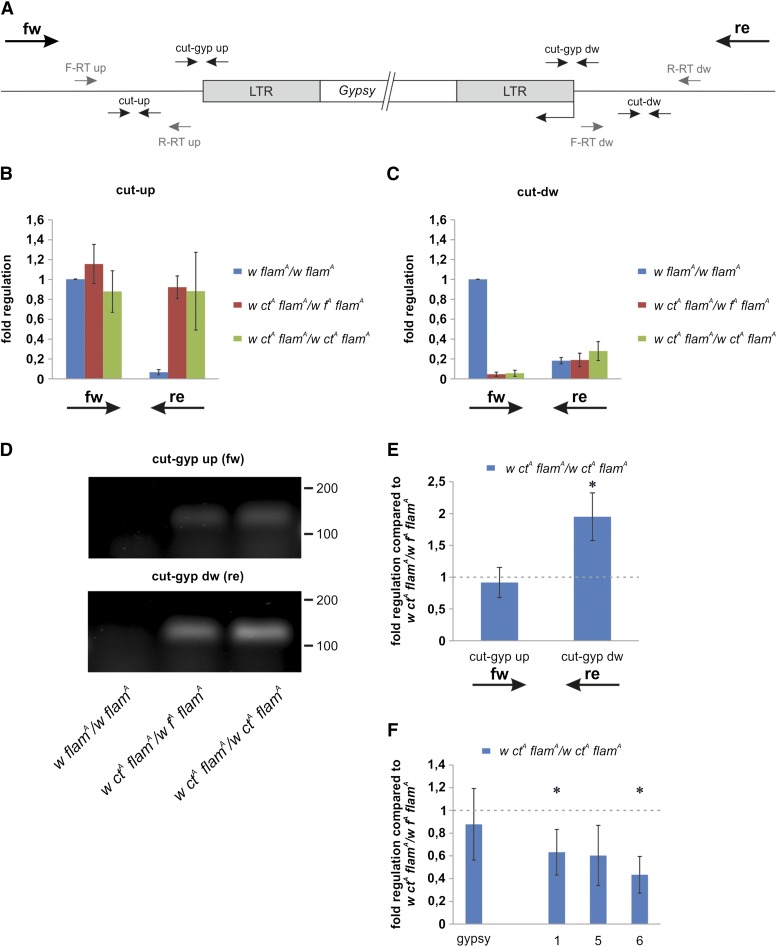
The gypsy insertion in the cut locus triggers the expression of fused transcripts from flanking genomic regions into the gypsy sequences. (A) Map of the gypsy insertion site in the cut locus and of the primers used in RT-PCR experiments (small arrows). Stand specific RT primers are represented in grey while qPCR primers are represented in black. fw arrow indicates direction of telomere-to-centromere expression while re arrow indicates direction of centromere-to-telomere expression. (B–F) RT-PCR experiments performed using RNA isolated from 0- to 24-hr-old female heads. (B, C) Strand-specific qRT-PCR reveals transcription in the genomic regions surrounding the gypsy insertion site in the cut locus. Transcription levels are variable and influenced by the pattern of the gypsy mutations present in each strain. Shown are average levels (n = 3), and error bars indicate SD. Retrotranscription of the cut-up site was primed by (B) primers F-RT up and R-RT up, while retrotranscription of the cut-down site was primed by (C) primers F-RT dw and R-RT dw. Primers cut-up were used to amplify the cut-up region while primers cut-dw were used to amplify the cut-down region. (D) Strand-specific RT-PCR products loaded in a 2% agarose gel confirming the presence of fused transcripts only in flies carrying the gypsy insertion in the cut locus. Primers cut-gyp up were used to amplify the forward fused transcript while primers cut-gyp dw were used to amplify the reverse fused transcript. DNA ladder scale is in base pairs. (E) Strand-specific qRT-PCR analysis of the transcription levels of the regions cut-gyp up and cut-gyp dw. Shown are average levels (n = 3), and error bars indicate SD (* P < 0.01). (F) qRT-PCR analysis. Shown are the transcript levels of gypsy and of three regions inside the flamenco locus (primers 1, 5, and 6; described in Figure 3A). Shown are average levels (n = 3), and error bars indicate SD (* P < 0.05).

