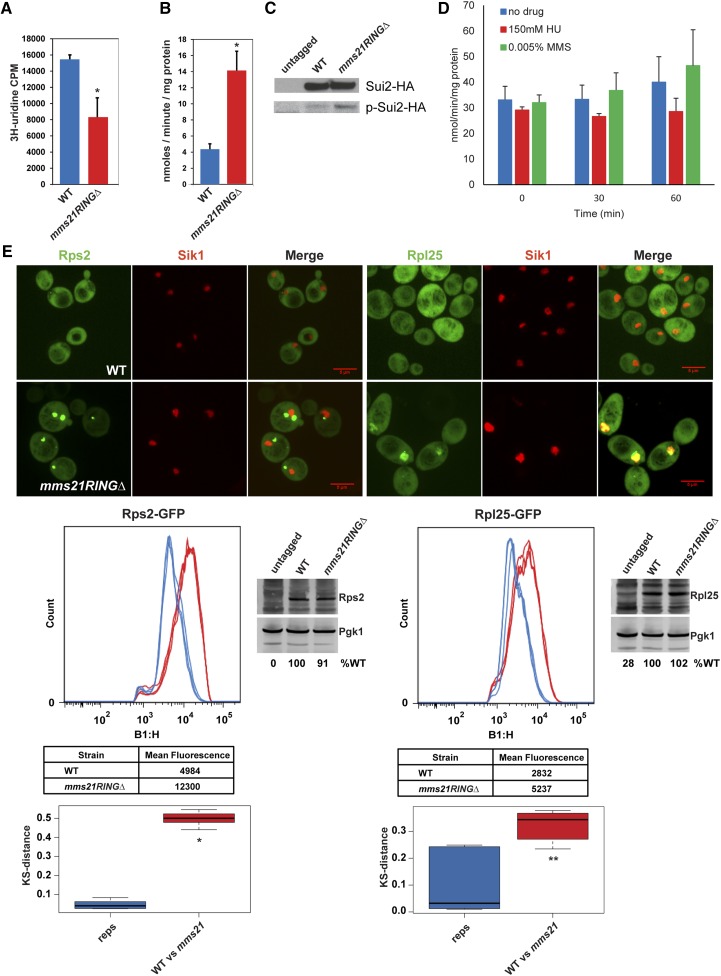
Figure 3.
The mms21RINGΔ mutant exhibits ribosome biogenesis defects. (A) rRNA production is reduced in mms21RINGΔ mutant. Both WT and mms21RINGΔ mutant cells were grown to midlog phase in SD −Ura medium containing 6.7 ng/μl uracil. The cultures were labeled with 3H-uridine for 5 min at 30°. Total rRNA level was measured by scintillation counting. Error bars indicate the standard deviation from three independent experiments. P = 0.0034. (B) Gcn4 translation is increased in the mms21RINGΔ mutant. Both WT and mms21RINGΔ cells were transformed with the p180–Gcn4–LacZ reporter plasmid and were grown to midlog phase at 30°. β-Galactosidase activity was measured using ONPG as a substrate. Error bars indicate the standard deviations from three independent experiments, P = 0.0012. (C) Sui2 is more phosphorylated in the mms21RINGΔ mutant compared to WT. The indicated strains were grown to midlog phase at 30°. Phosphorylation level of Sui2HA, in both WT and mms21RINGΔ strains was analyzed using anti-phospho eIF2α (Serine 51, Cell Signaling) and anti-HA antibodies via Western blotting. (D) Gcn4 translation is not elevated by treatment of WT cells with either 150 mM HU or 0.005% MMS for 30 or 60 min. WT cells were grown to midlog phase and treated with either 150 mM HU or 0.005% MMS for 30 or 60 min at 30°. Gcn4 translation level was measured as shown in B. (E) Rps2 and Rpl25 ribosomal proteins accumulate in mms21RINGΔ mutant. Both WT and mms21RINGΔ mutants were transformed with either the Rps2–GFP or Rpl25–GFP reporter plasmid. Live cell images were taken using confocal microscopy with a ×100 objective (Perkin Elmer Ultraview Spinning Disk) and the Volocity 6.3 software program. Bars, 5 μm. For Rps2–GFP or Rpl25–GFP quantification, the strains carrying Rps2–GFP or Rpl25–GFP were grown to midlog phase at 30° in SD −Leu medium supplemented with 0.02 mg/ml adenine. Mean peak GFP fluorescence intensity was measured by performing cytometry analysis. The number of cells or “count” is shown on the y-axis. GFP intensity histograms were plotted using the Macsquant B1-H::FITC-H detector (B1-H, x-axis). The x-axis represents the log scaled pulse height parameter from detector B1, which uses 488-nm excitation and collects fluorescence emission using a 525/50 bandpass filter. The KS test was used to measure the distances between three biological replicates (reps) and the distances between WT and mutants (WT vs. mms21). P-values were measured using a t-test. * P = 1.8953e-13, ** P = 0.00322.

