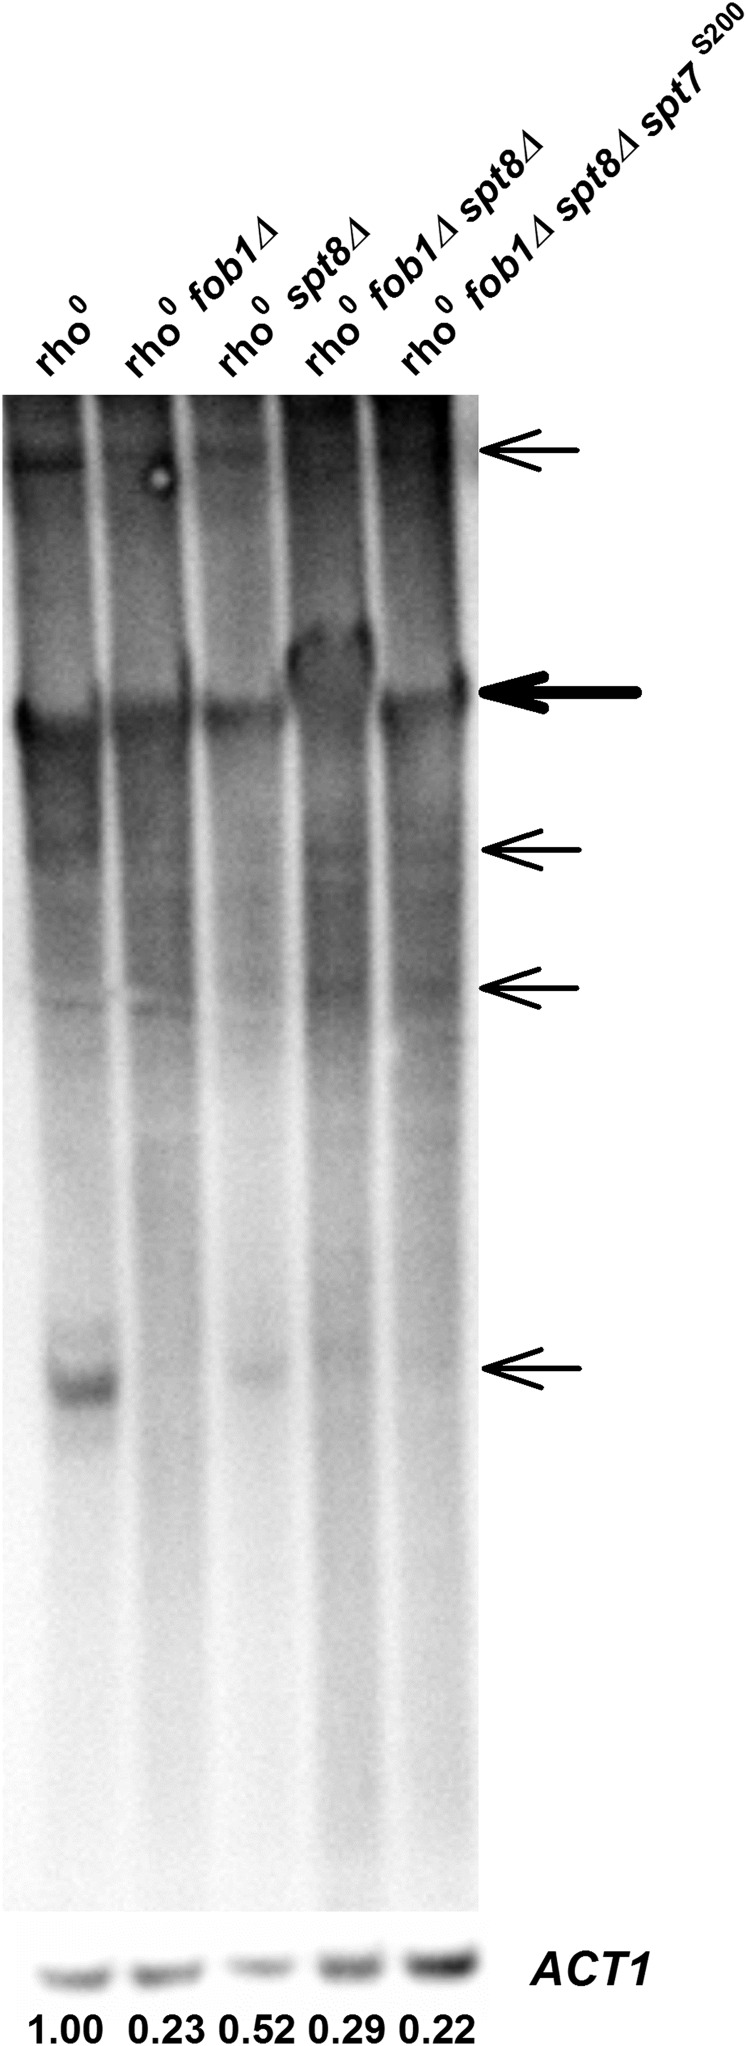
Figure 3.
Analysis of ERCs in rho0 strains. DNA prepared from the indicated rho0 strains was electrophoresed and Southern blots were probed for rDNA and ACT1 (see Materials and Methods). Bands representing the hybridization signal for genomic rDNA are indicated by the thick arrow, while the ERC bands are indicated by the thin ones. For quantification of ERCs, the sums of the signal intensities for the ERC bands in each lane were normalized against the hybridization signals of ACT1 in those lanes, and the results are shown at the bottom of each lane with the intensity of the parental rho0 strain set to 1.00. Similar results were obtained in three separate experiments.

